Cartos · Inside the interface

This is what geospatial looks like when it stops being software for specialists.

Aging GIS makes you a cartographer before it lets you be an analyst — dozens of dialog boxes, projection errors, a license per seat, and a consultant on retainer. Cartos collapses all of it into one screen: satellite, 3D, live operations, and an AI analyst that does the work with you. No GIS experience required.

One screen

Everything in view, nothing to install.

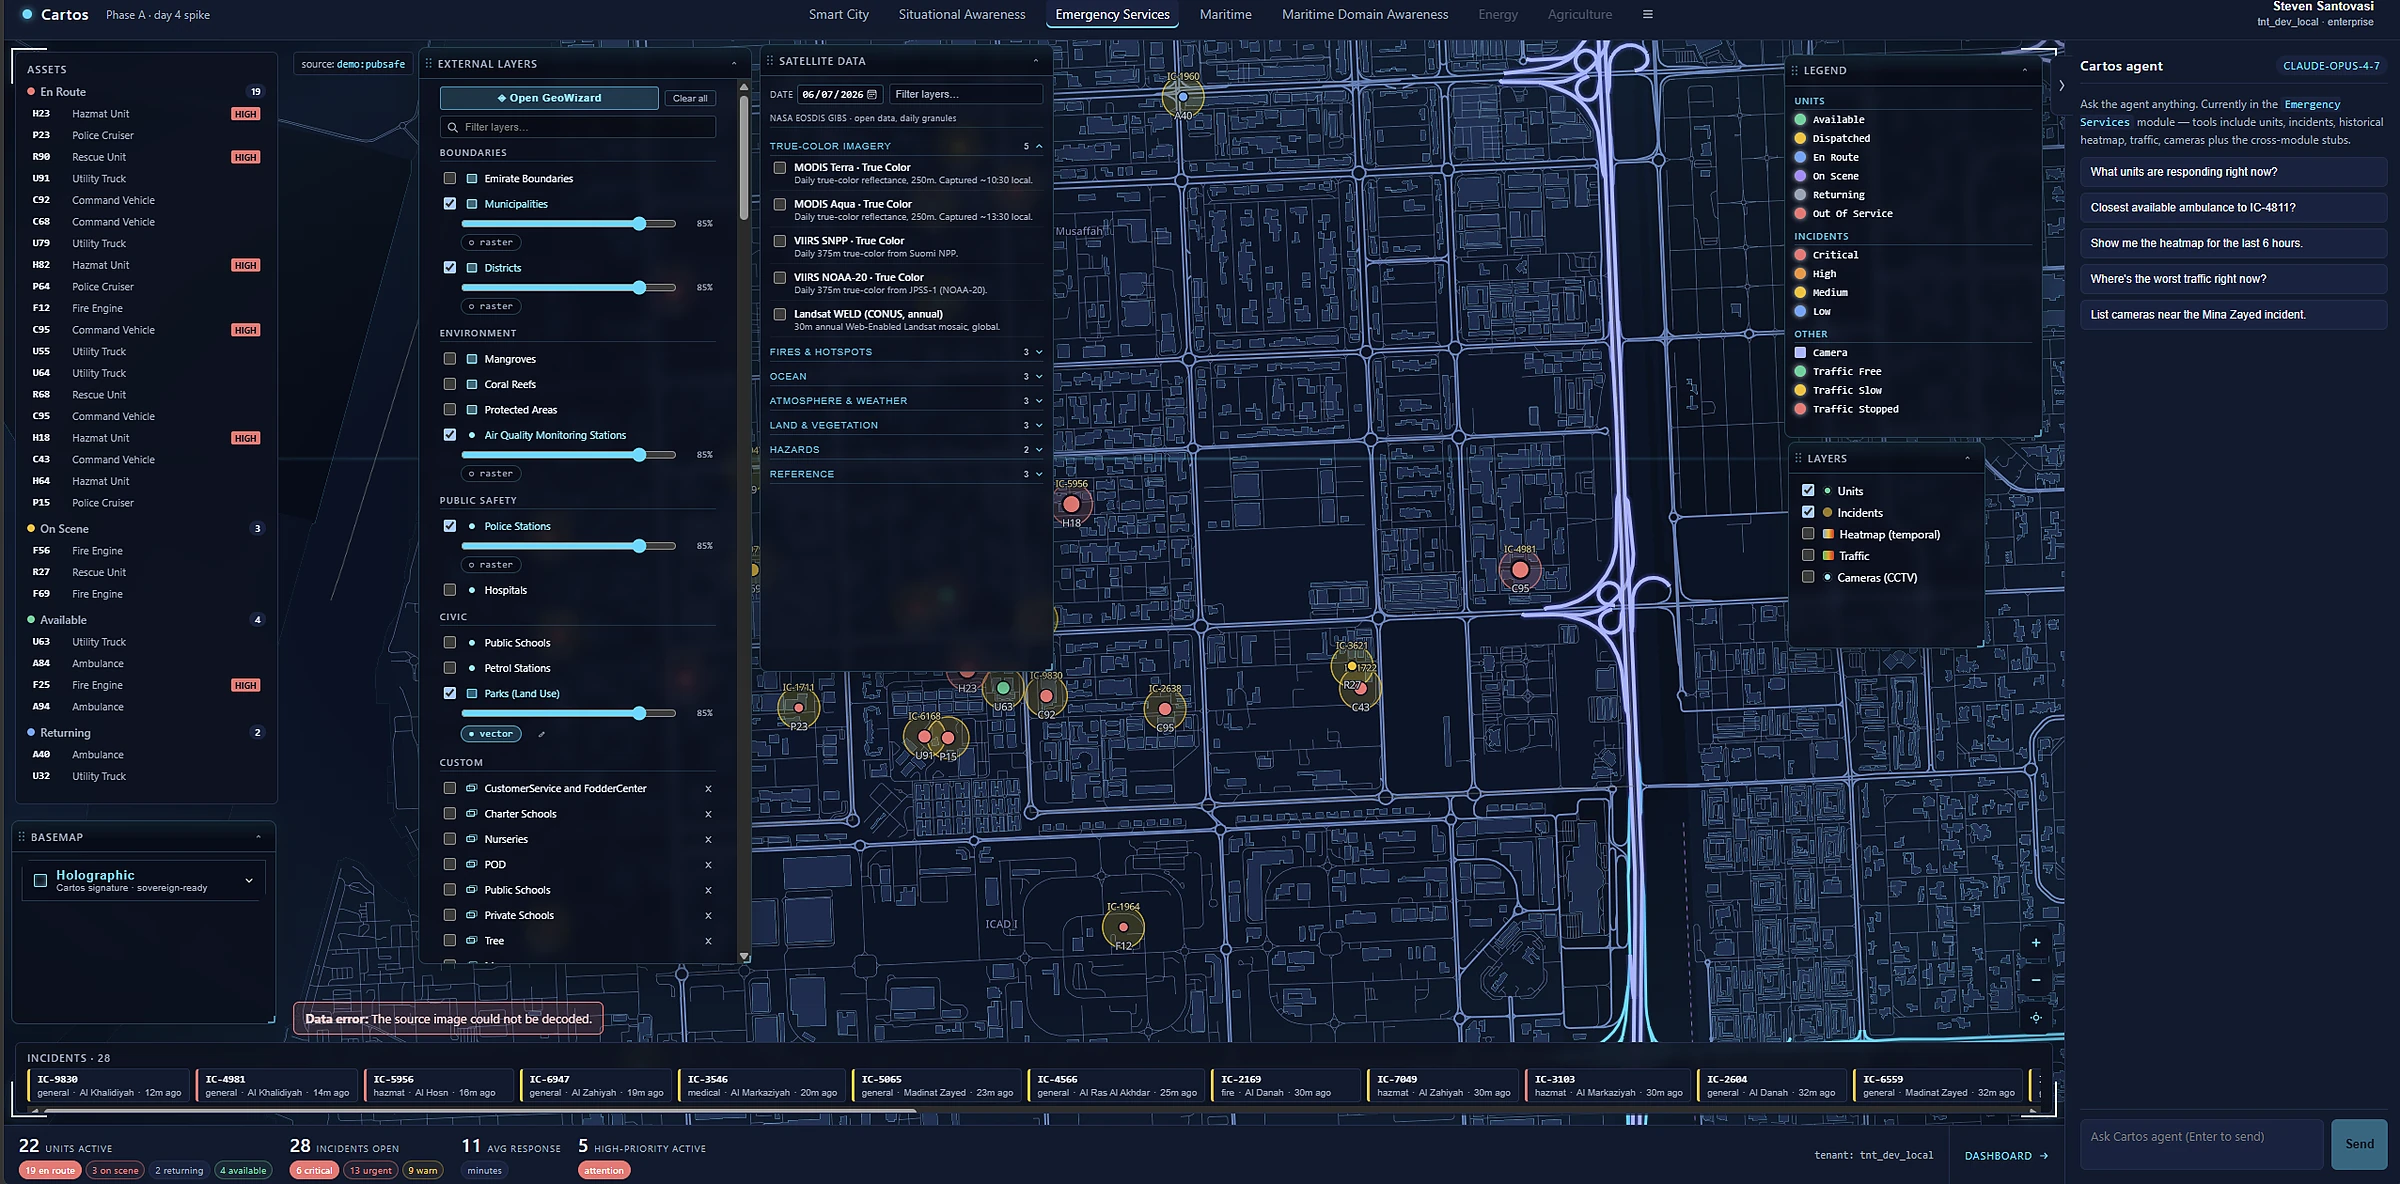
Live data, a layer catalog, the map, and the Cartos agent — side by side in the browser. The whole operating picture, from one URL, in your own deployment.

The Cartos operations workspace: a city map with live incident markers, a layer catalog on the left, an incident feed in the centre, and the Cartos AI agent on the right.
Live operations. Layers, incidents, map, and the agent — one workspace, no desktop install.

The delta

Three things aging GIS structurally can't do.

These aren't features bolted onto an old core. They're the reason Cartos exists — and the reason a thirty-year-old GIS stack can't follow.

01 · Modular

Verticals, not projects.

City, port, and emergency operations are slices over one shared data fabric, agent, and shell. Turn a capability on per account — you don't rebuild, re-license, or re-train to add the next one.

Aging GIS: every new use case is a fresh project, a new server, another integrator.
02 · Agentic-first

Ask, don't author.

An AI analyst is wired in from the first click. Ask a question in plain language; it focuses the map, pulls the layers, and runs the workflow using the platform's own tools — and shows its work.

Aging GIS: a toolbox of 800 tools and a model-builder you have to learn first.
03 · Future-proof

Sovereign & built to compound.

Runs in-territory on infrastructure you control, fed by an owned satellite constellation. The same substrate is growing into change detection, 3D reconstruction, and auditable reporting — your deployment gains them without a migration.

Aging GIS: perpetual upgrades, data lock-in, and a roadmap you don't own.

01 · The front door

It starts with a question — not a toolbar.

In every other GIS, the first thing you meet is a wall of tools you have to learn. In Cartos, the first thing you meet is a chat box.

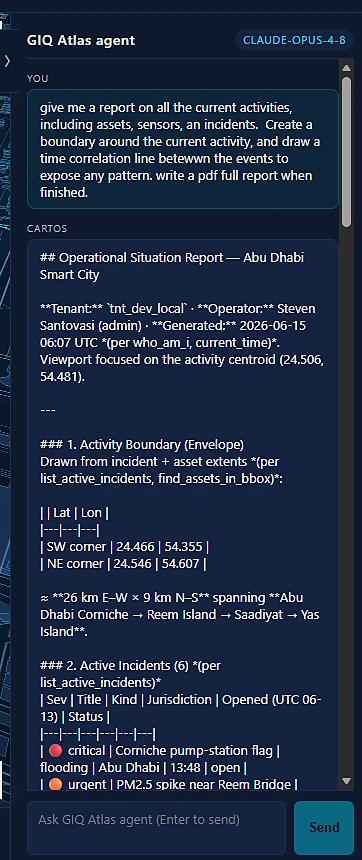
Ask "what's happening near the light rail?" or "show me units by jurisdiction" and the Cartos agent drives the platform for you — focusing the map, switching on the right layers, and running the query, then explaining what it did. Answers come back rich — tables, charts, links, and a summary with recommendations — and resize, pop out, and export to PDF/DOCX. It's docked beside the map at all times, with suggested prompts so a brand-new user is productive on the first click.

And because the agent speaks MCP, a parent AI — Claude, Copilot — can call Cartos's geospatial tools directly, folding the sovereign platform into a larger reasoning workflow.

The Cartos agent panel: an Cartos agent header with a Claude Opus model badge, an intro line, and suggested prompts such as 'What units are responding right now?' and 'Closest available ambulance to IC-4811?', above an 'Ask Cartos agent' input.
The Cartos agent. Plain-language questions in; a driven map and a clear answer out.

02 · The decision surface

The map shows you where. The dashboard shows you how it's going.

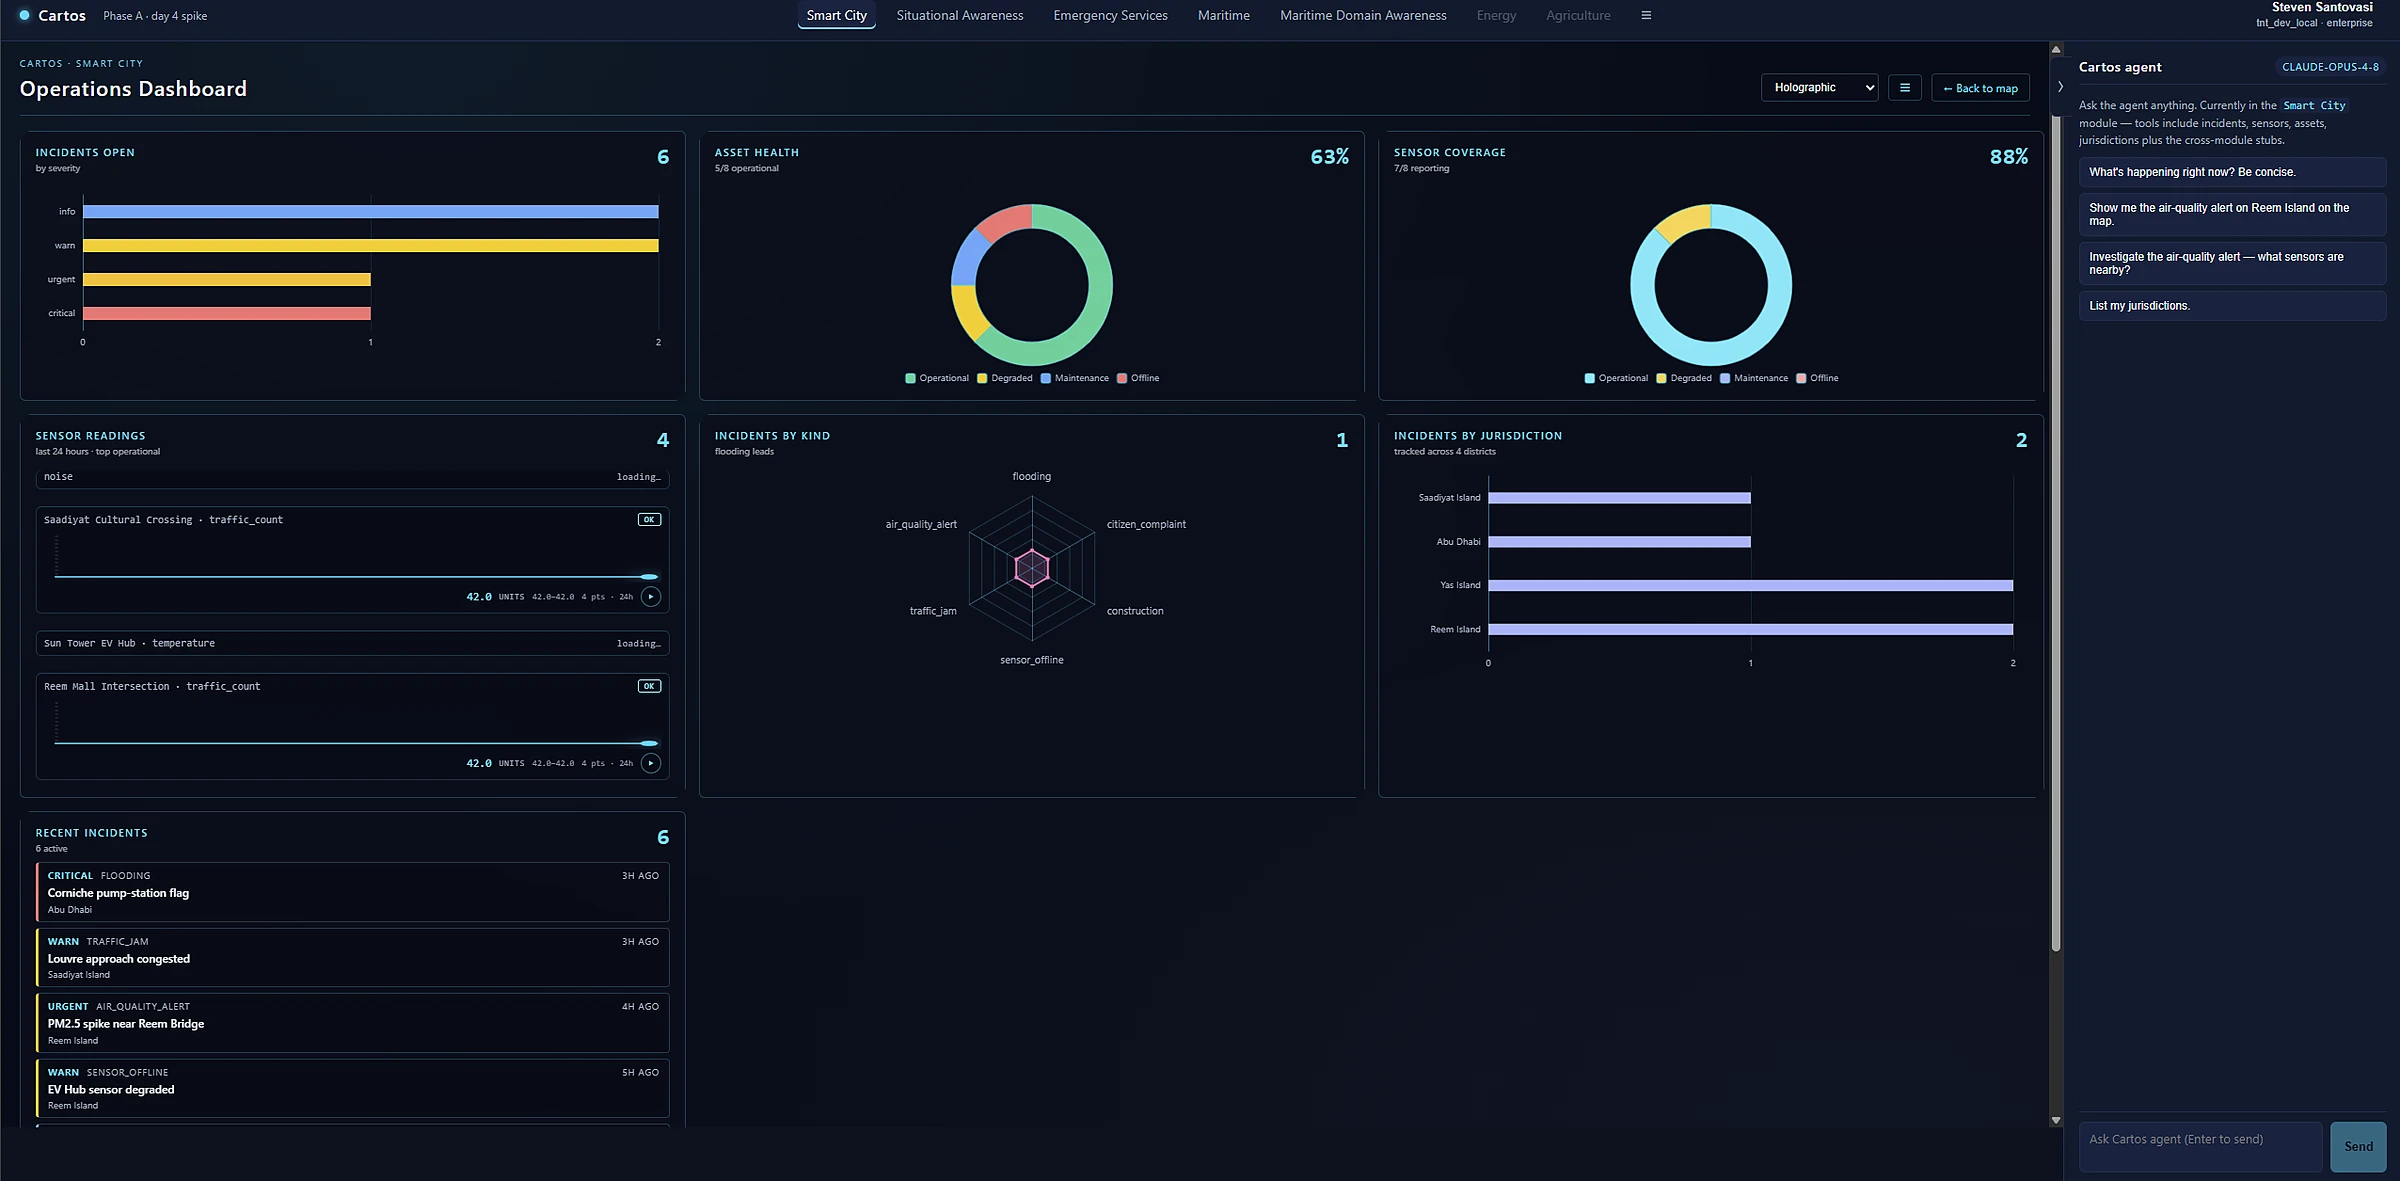
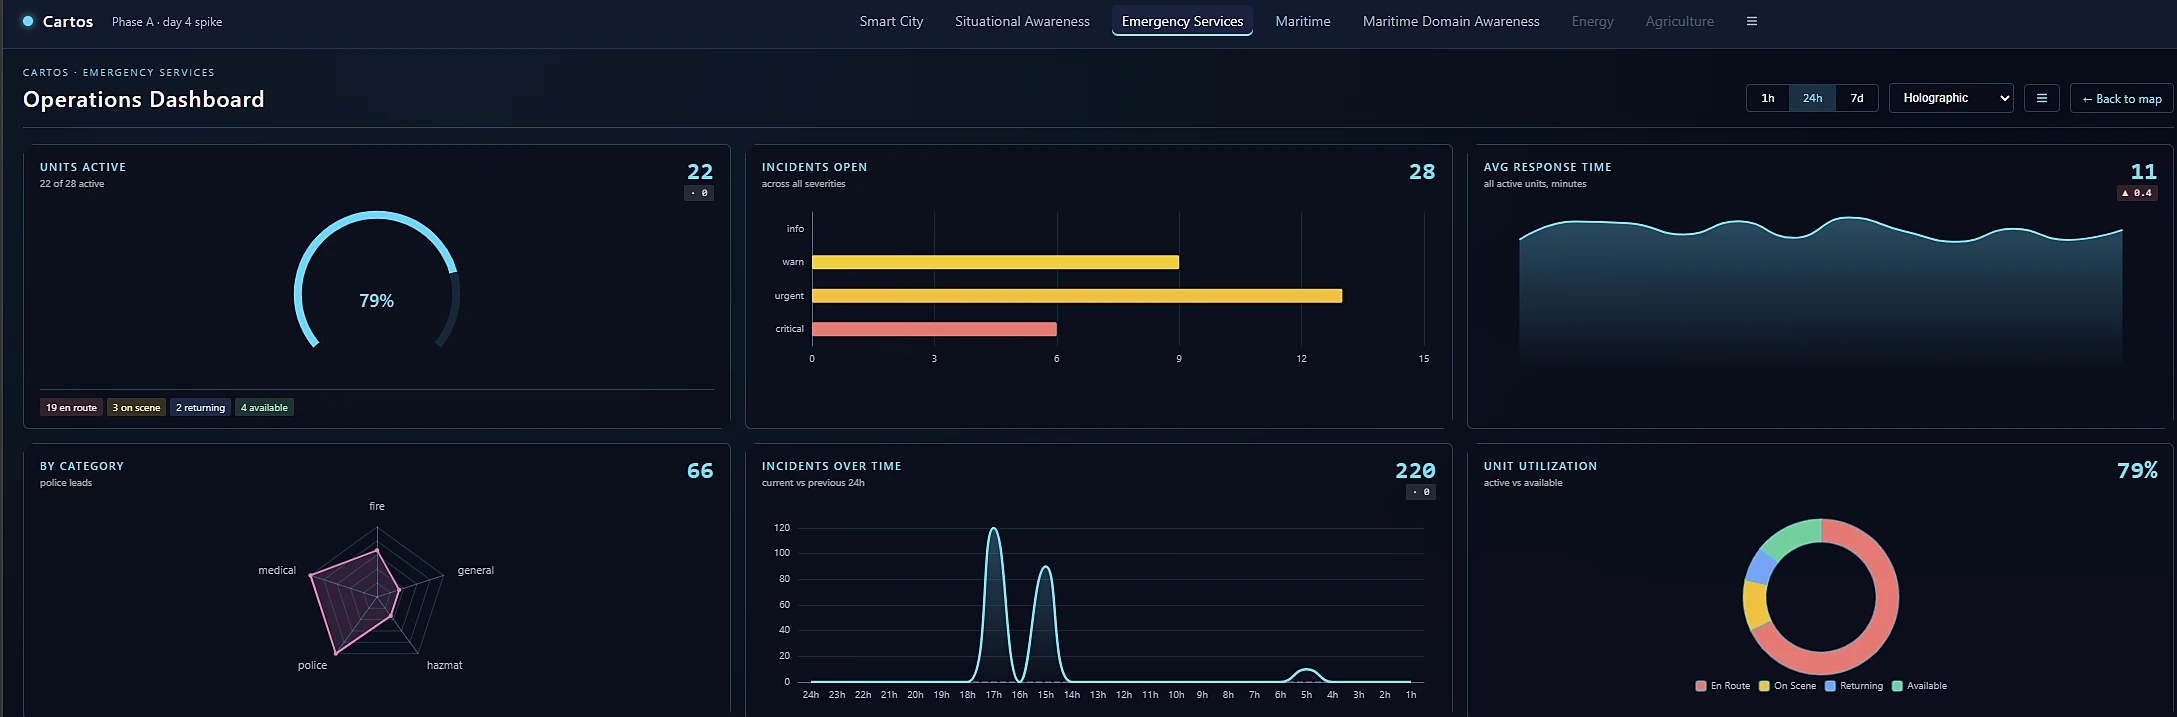
Operations aren't run from a basemap alone. Every module pairs the map with a live dashboard — units active, incidents open, response times, asset health — so the picture and the numbers never live in two different tools.

Operations Dashboard · Ops floor The Cartos operations dashboard in dark mode with KPI rings, incident charts, asset health, and a recent-incidents feed.

The numbers behind the map

KPI rings, incident severity, response-time trends, and a live incident feed — a full operational read-out beside the map, not a separate BI tool to license and stitch in. It updates as the situation does.

Operations Dashboard · Briefing wall The same operations dashboard rendered in a light holographic theme, showing response-time trends and unit utilisation.

Themeable for the room you're in

The same data, one click away from a holographic theme built for a command-centre wall. Dark for the ops floor, luminous for the briefing — no rebuild, no second dashboard to maintain.

03 · Getting data in

Bring any data in — without being a GIS admin.

The hardest part of legacy GIS is often just getting the data onto the map: formats, projections, server connections. Cartos turns that into a marketplace and a search box. Browse, search, or paste a URL — and it lands as a styled, persistable layer.

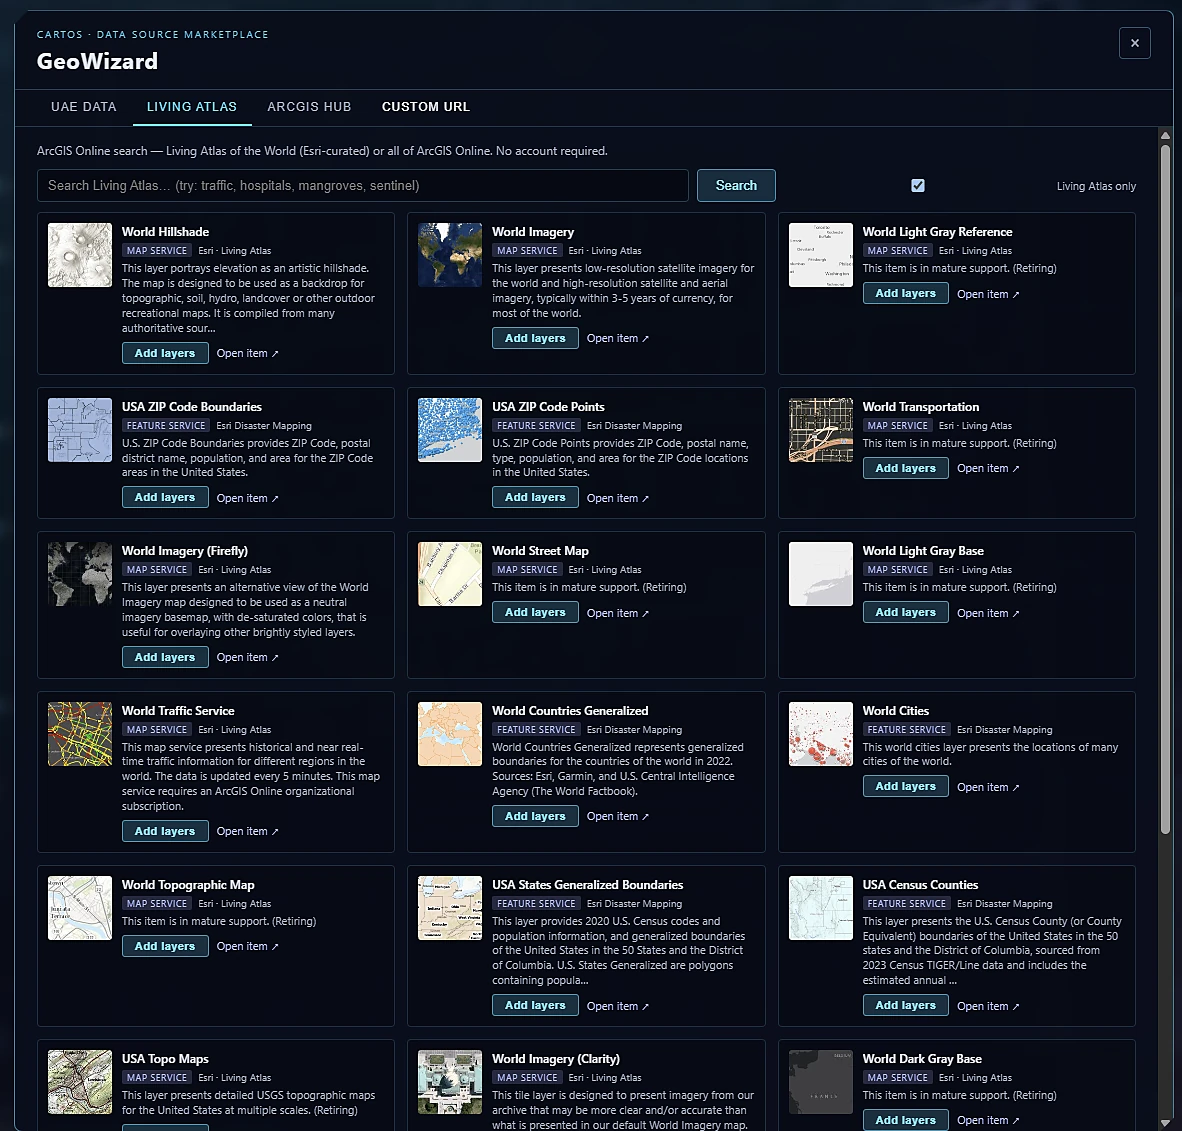
GeoWizard · Data Marketplace The GeoWizard data-source marketplace listing federal, international, and UAE geospatial data sources ready to add as layers.

A marketplace of live data sources

GeoWizard curates national and global catalogs — federal, international, and UAE-specific sources — each one ready to add as a layer. No hunting through portals, no format wrangling: the discovery step that used to take a day becomes a browse.

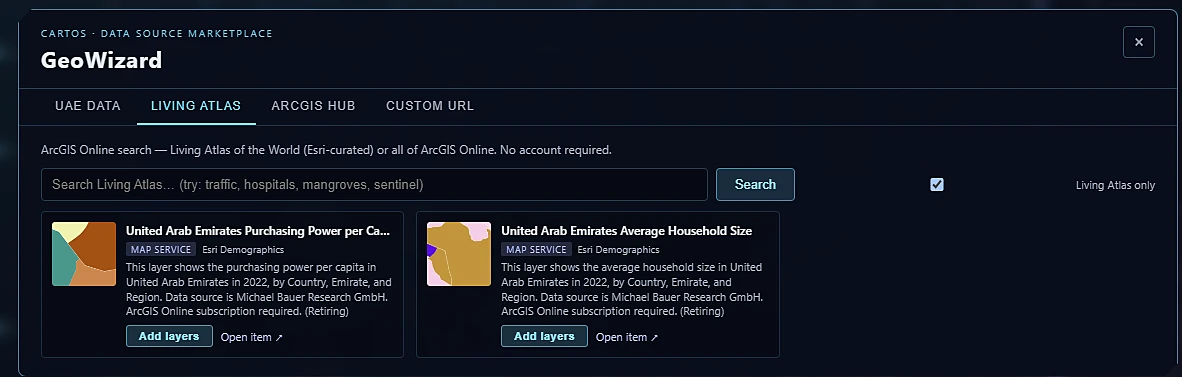
GeoWizard · Living Cartos search GeoWizard searching Esri Living Cartos for UAE demographic map services, each ready to add as a layer with one click.

Search the world's open data — no account needed

Type "traffic", "hospitals", "mangroves", "sentinel" and results come back from Esri's Living Cartos ready to drop on the map with one click. Open data discovery, collapsed into a single search field.

04 · Seeing the world

From a single pixel to a whole region — in 2D and 3D.

One surface renders every way you need to see the world: your own high-resolution imagery, photoreal 3D, continuous sensor surfaces, and styled vector networks — without ever exporting to a second application.

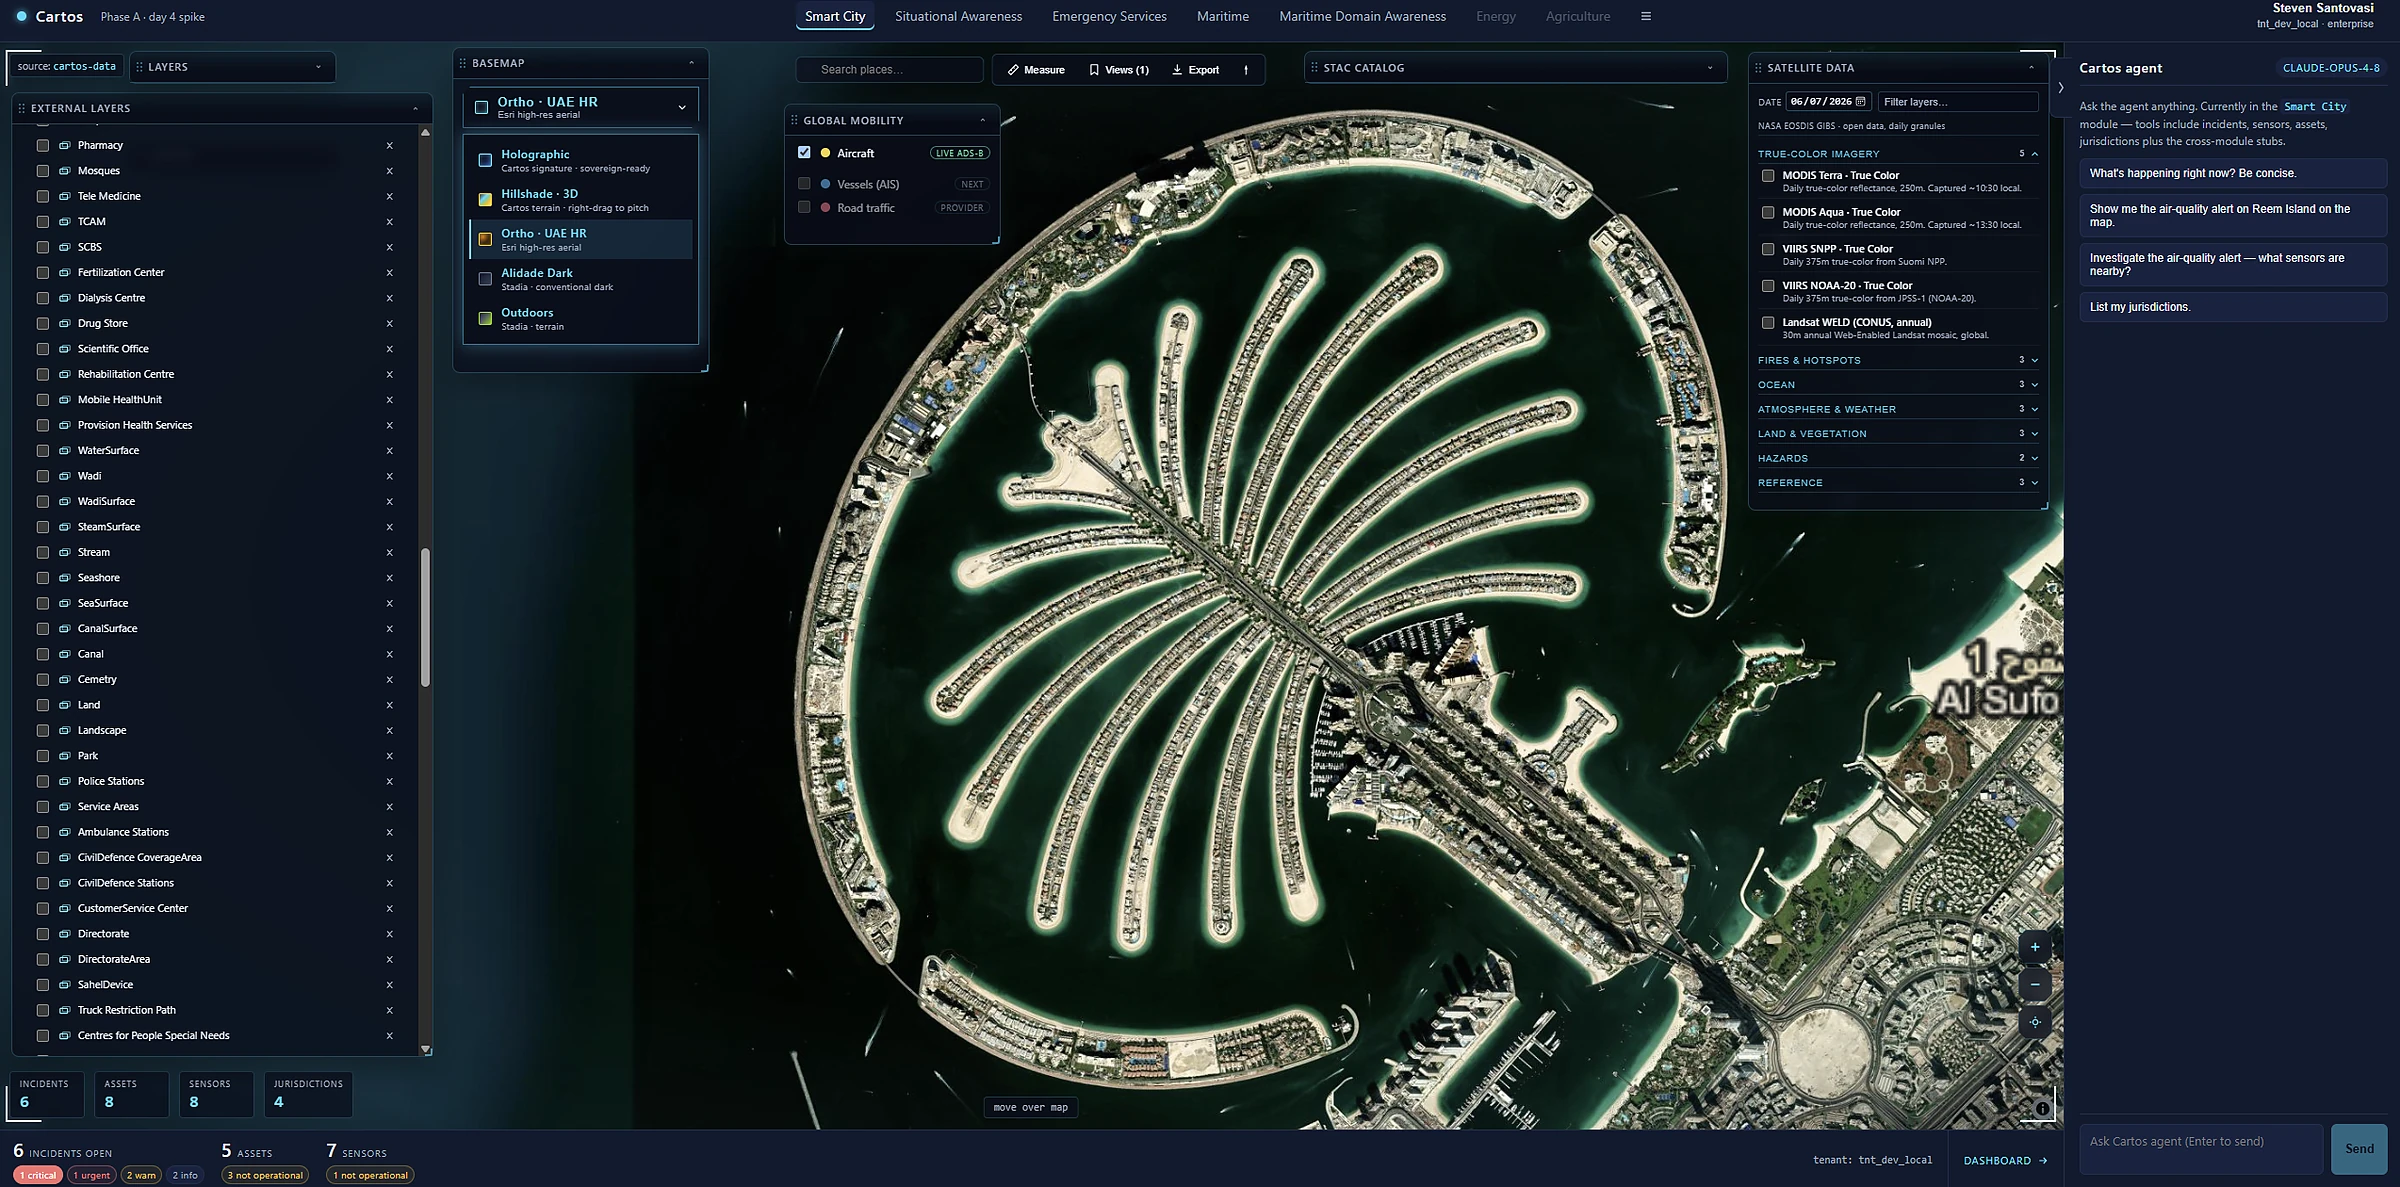
Satellite Imagery High-resolution satellite imagery of the Palm Jumeirah rendered in the Cartos map surface.

Your own imagery, on tap

High-resolution satellite layers stream straight onto the surface — backed by an owned constellation. That owned data position is something competitors can't simply license into, and it's available to every module by default.

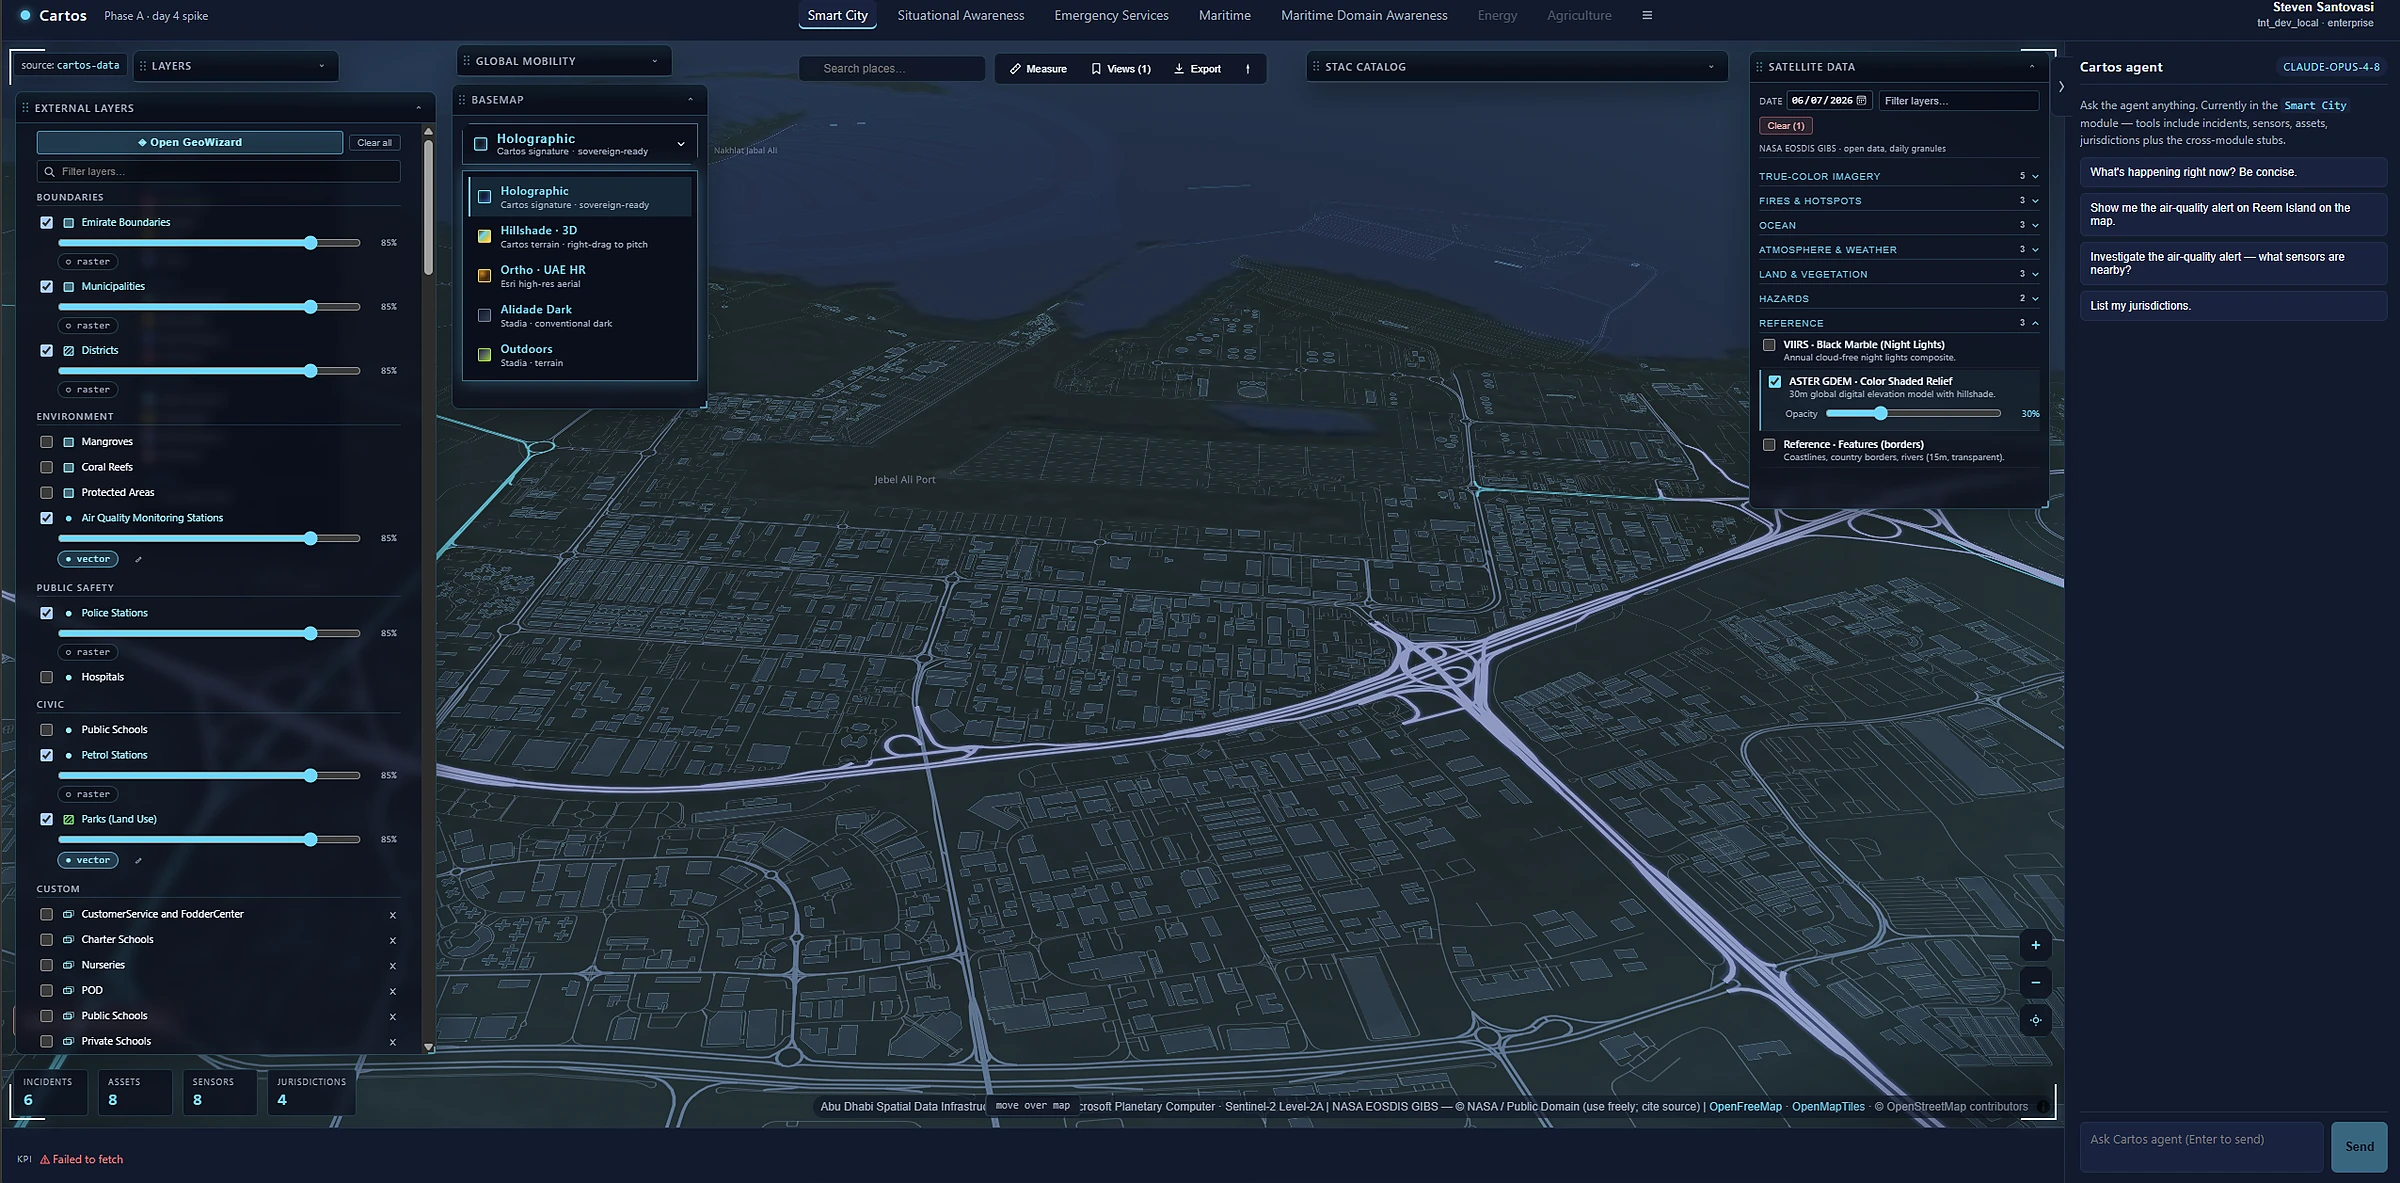
3D Terrain & Buildings A tilted 3D view of an urban area with extruded buildings, terrain, and a road network in the Cartos globe.

Drop into 3D without leaving the page

Tilt into a photoreal scene — terrain, buildings, infrastructure — in the same workspace. No separate 3D app, no export-and-import dance between tools.

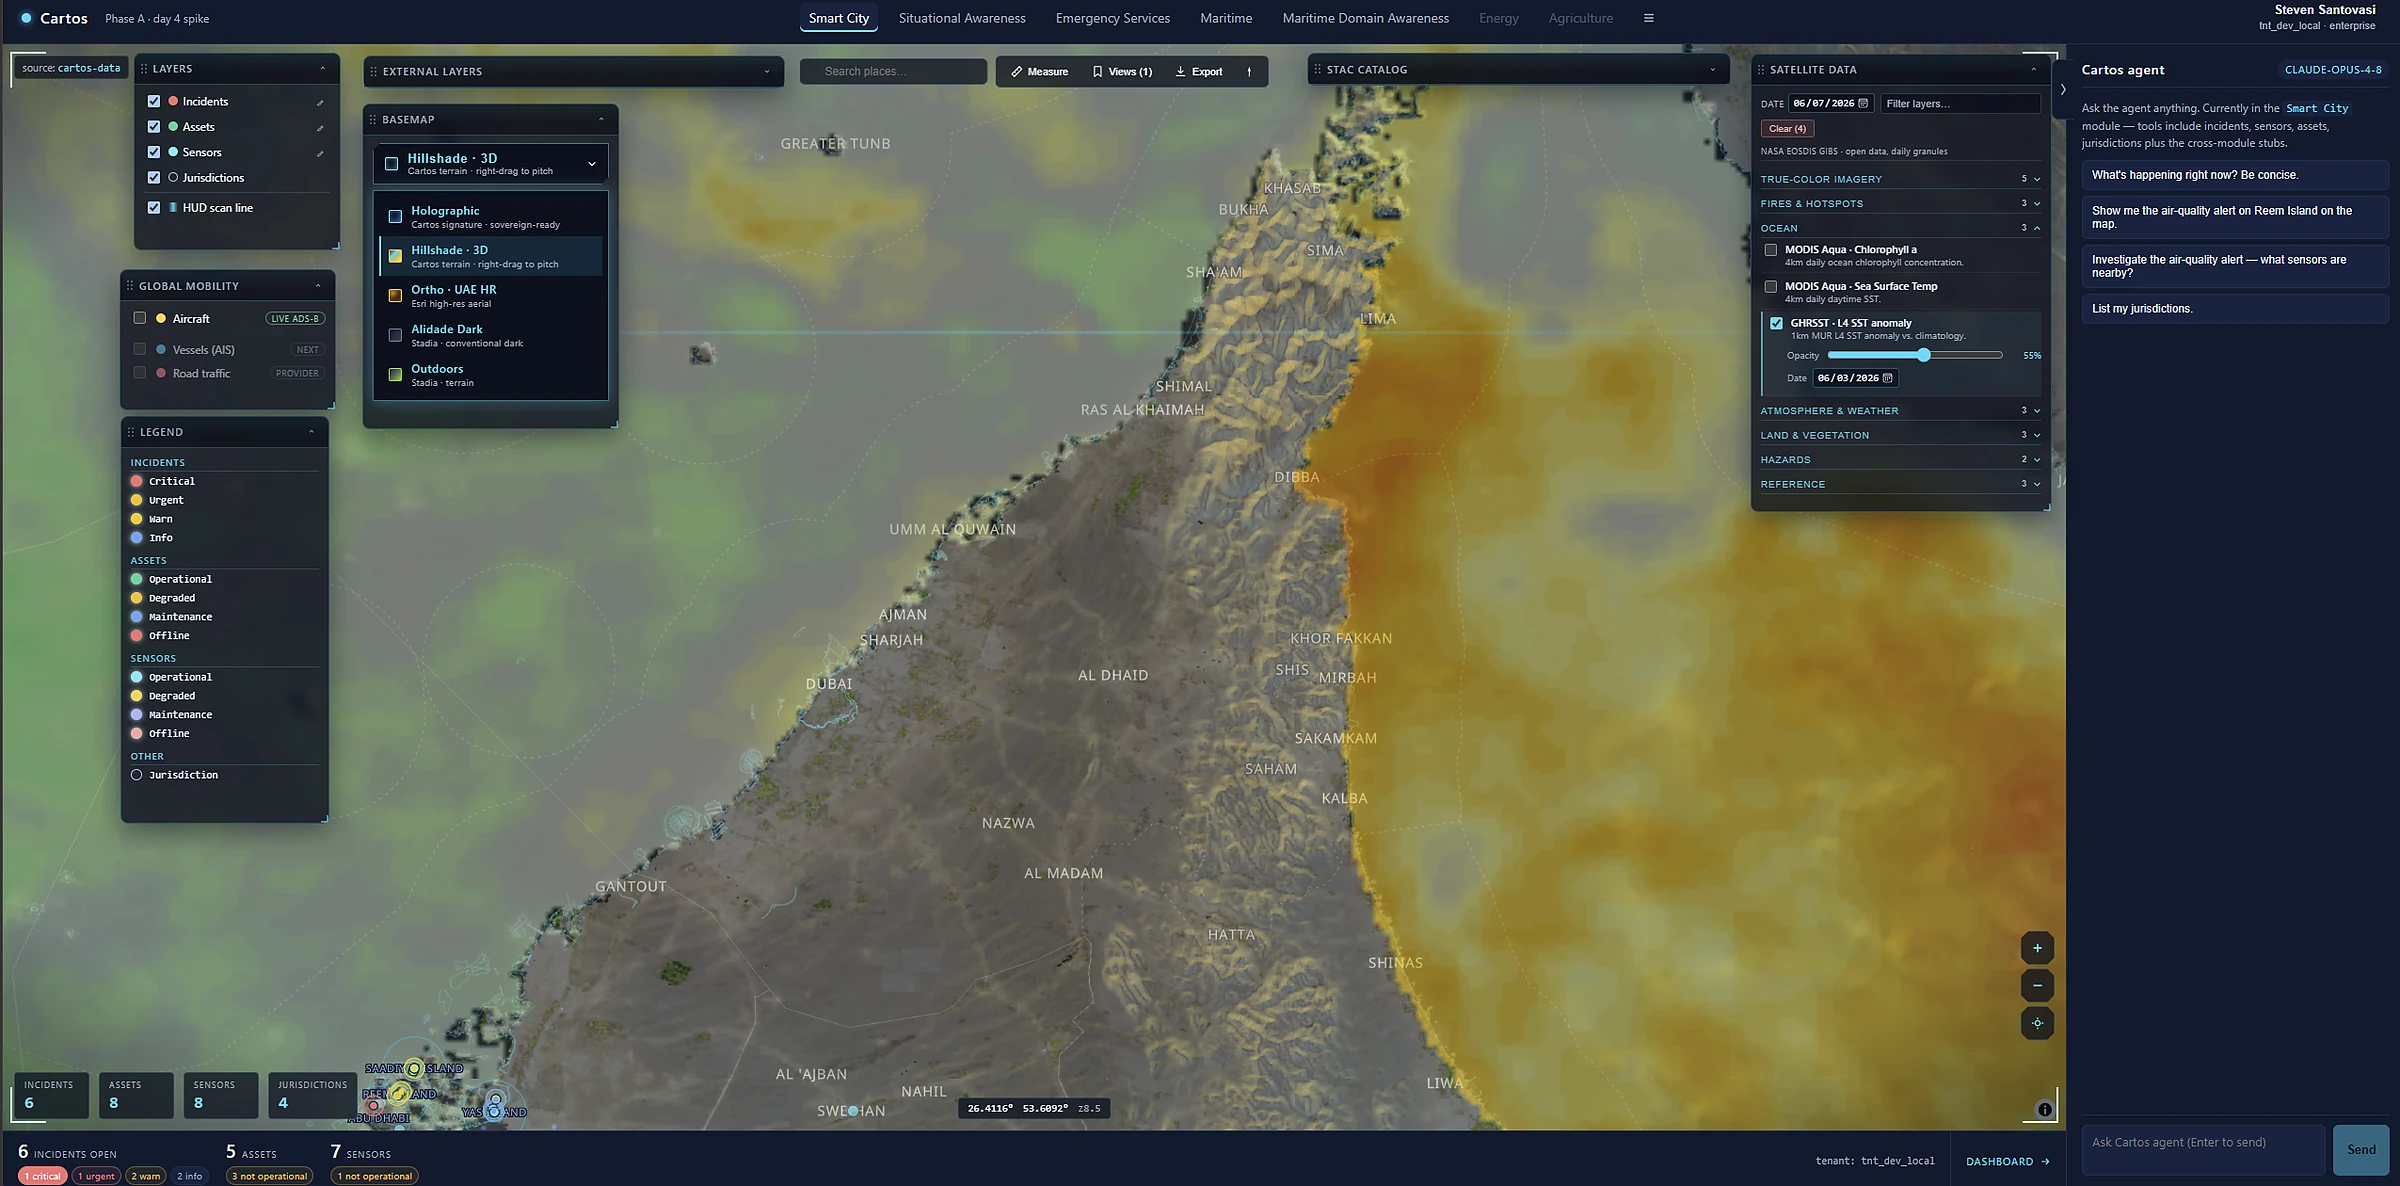
Environmental Analysis A continuous environmental heatmap over the UAE coastline rendered as a smooth colour gradient in Cartos.

Continuous data, read at a glance

Environmental and sensor surfaces render as smooth gradients — turning raw measurements into something a decision-maker reads in a second, not a spreadsheet.

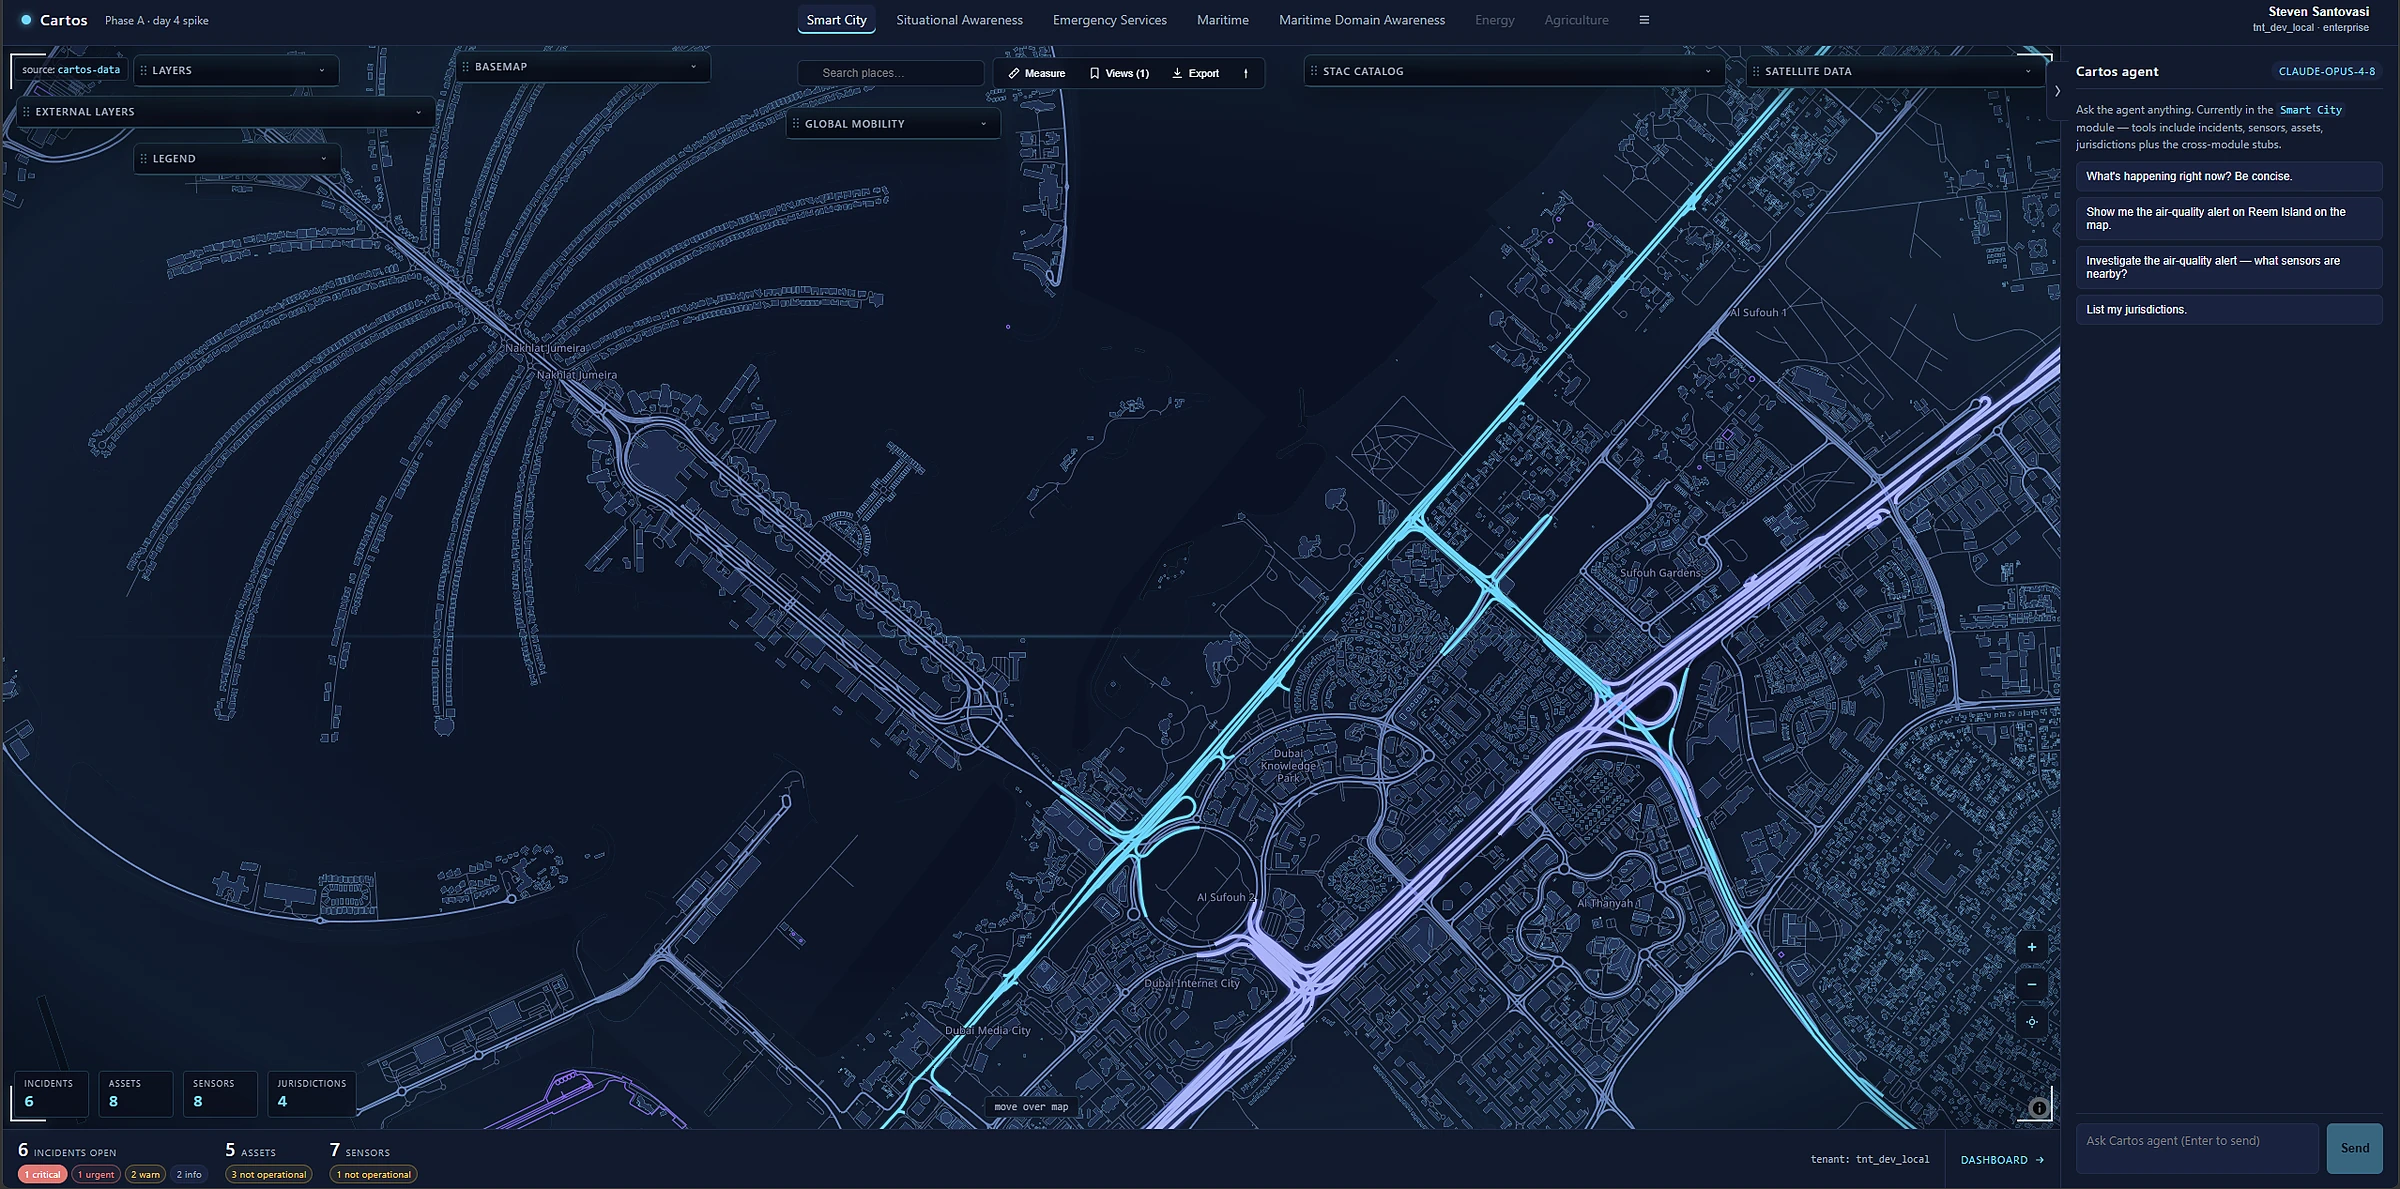
Network & Mobility A stylised vector view of a city road and transport network, with corridors highlighted in cyan and violet over a dark base map.

Infrastructure, styled to mean something

Road and mobility networks render as living vector layers — corridors, flows, and assets you restyle on the fly to surface exactly the pattern you're chasing.

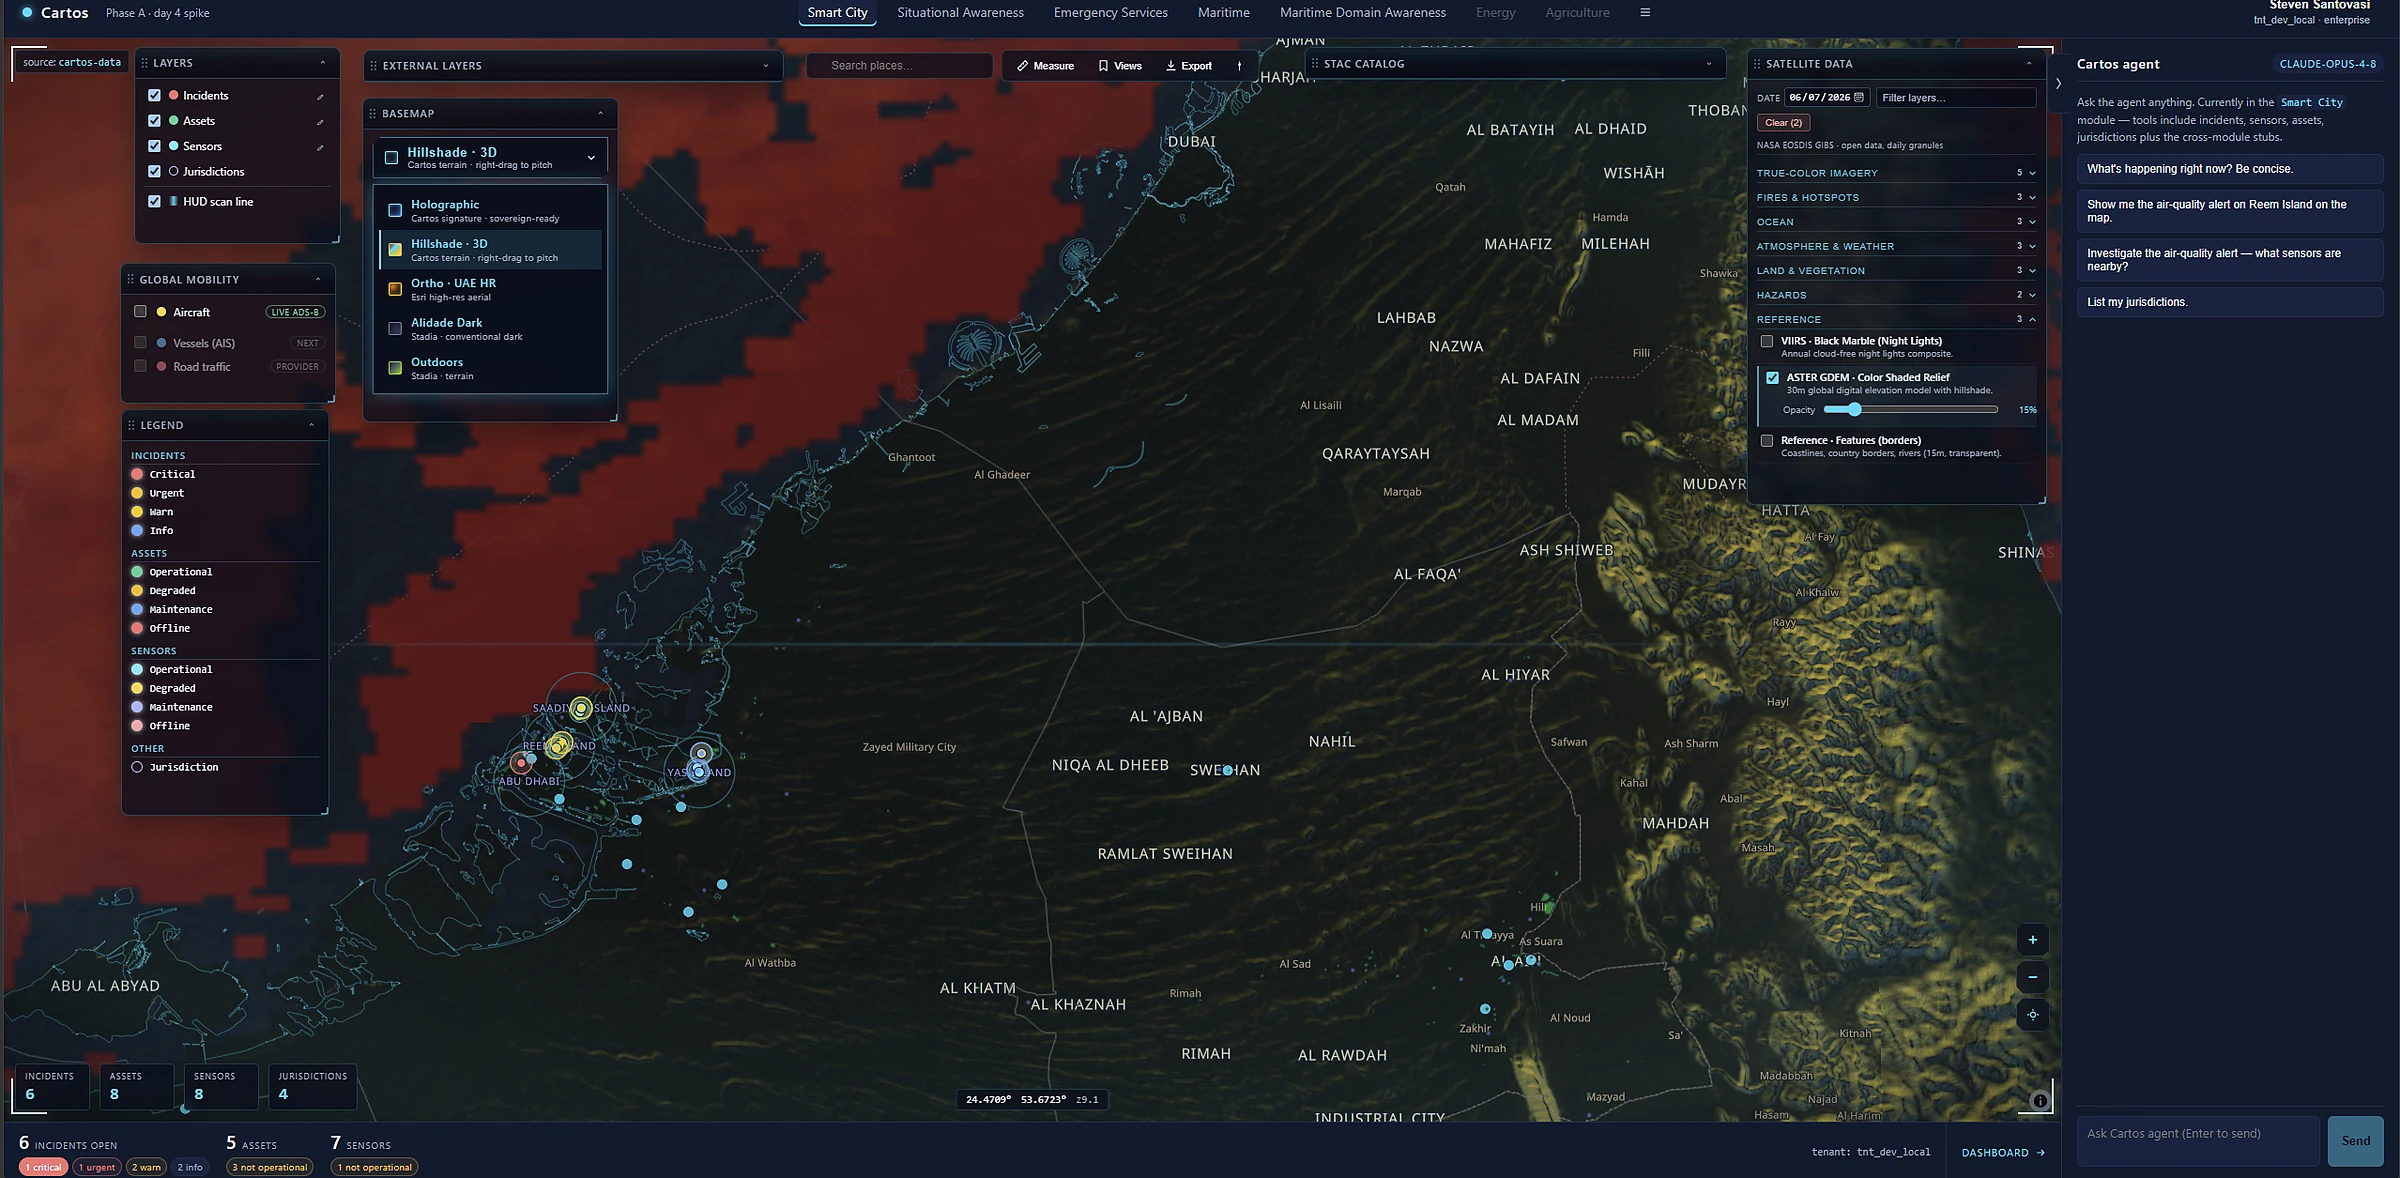
Regional & Maritime A wide regional Cartos map with terrain shading and vessel and asset markers across territorial waters.

From one street to a whole region

Zoom from a single incident out to coverage across territorial waters — assets, vessels, and context in one continuous picture, governed by the same team-level access rules throughout.

05 · Reasoning about change

Run GeoAI over the view — and get an auditable report back.

The Analyst Intelligence layer turns the map into something that reasons. Run a real GeoAI model over your area — segmentation, or two-epoch change detection on live satellite imagery — and the result lands as a lineage-tracked layer you can read, tune, compare, and export. Choose where it runs — a sovereign local tier or a full GPU — and every finding traces back to the imagery that produced it.

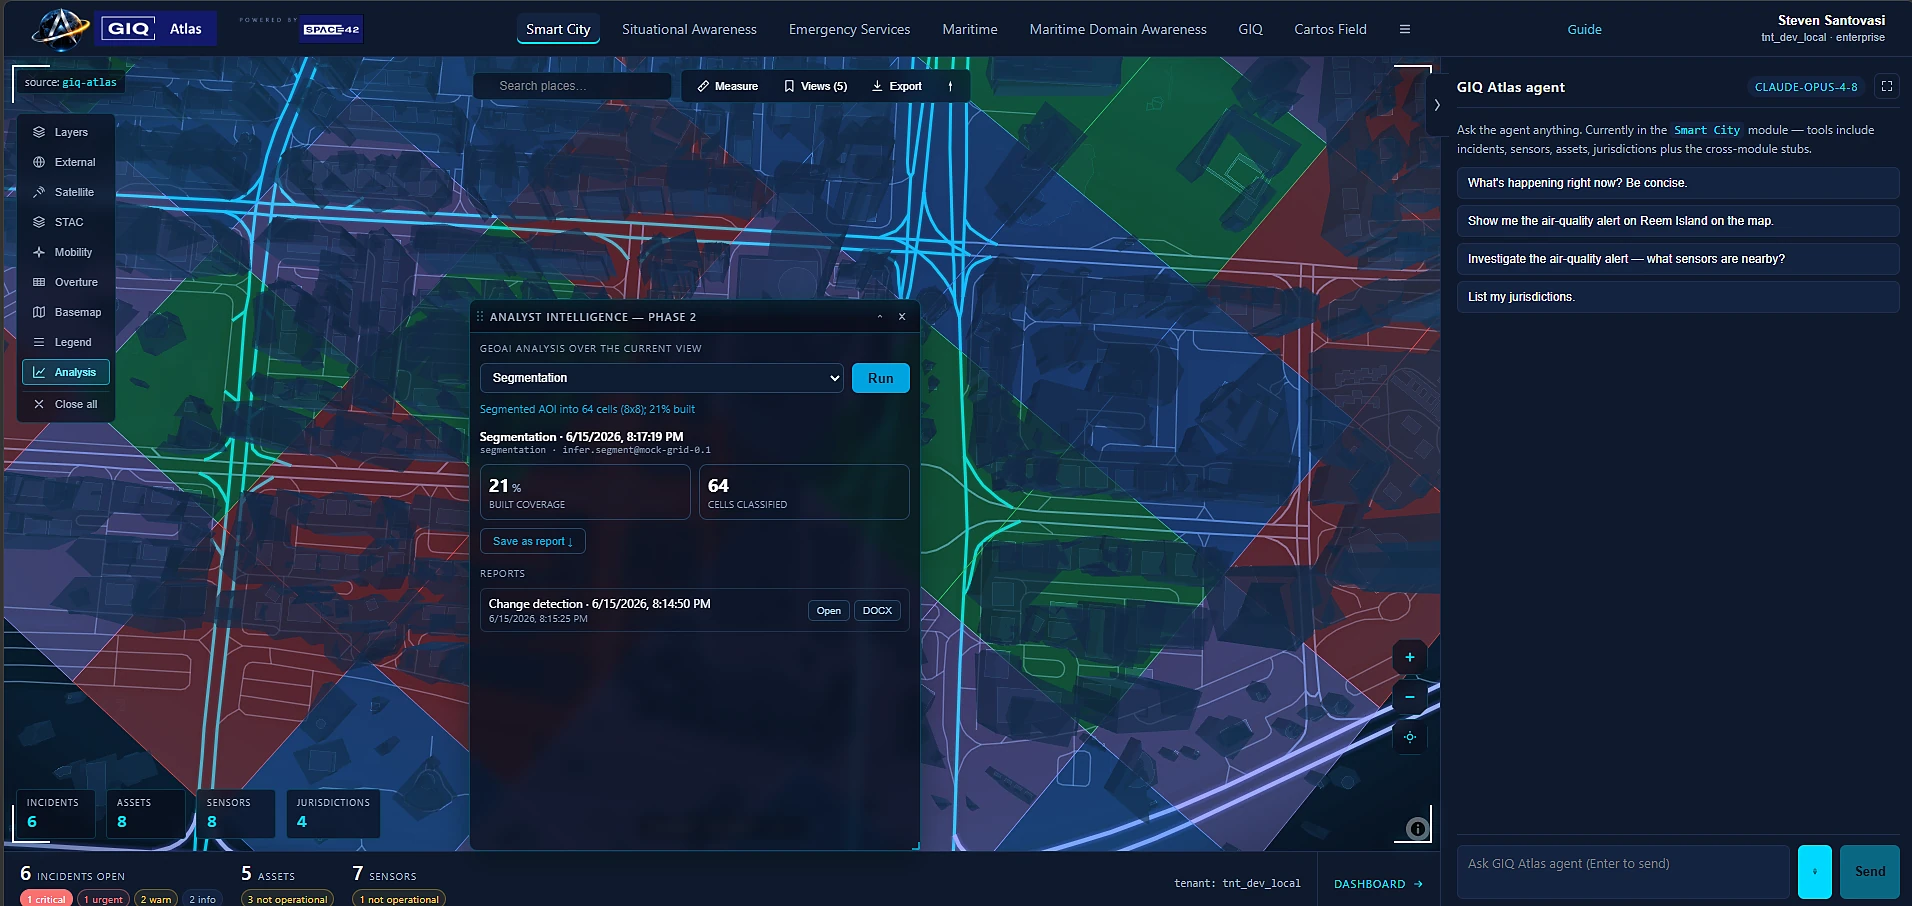
Analyst Intelligence · GeoAI over the view The Analyst Intelligence panel running a segmentation model over the current map view, with the classified result rendered as coloured cells and headline KPIs.

Ask the map a question a model can answer

Pick an analysis, run it over the current view, and a real segmentation model runs on live satellite imagery for your area — the produced dataset renders on the map with its KPIs. No GIS toolbox, no export to a separate ML pipeline: it runs in the same workspace as an async job, on the sovereign local tier or a full GPU.

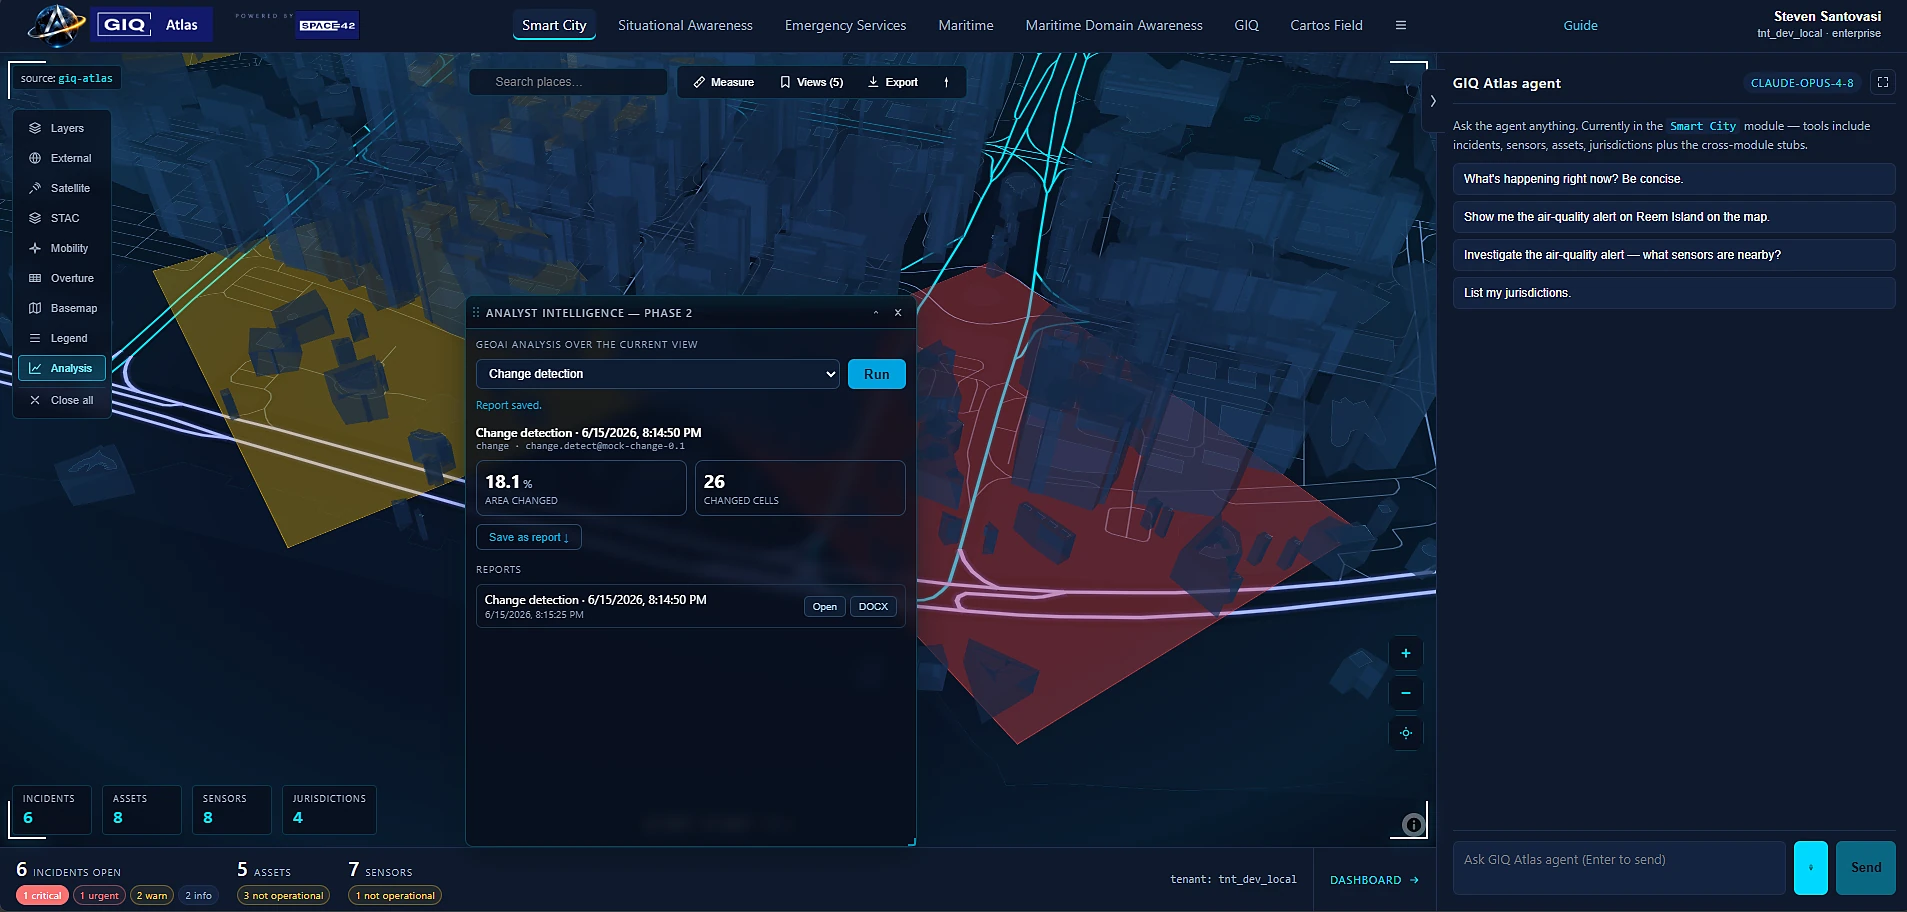
Analyst Intelligence · Change detection Two-epoch change detection over an area of interest, highlighting changed cells with per-cell confidence on the Cartos map.

See what changed between two moments

Pick two dated Sentinel-2 scenes over your area; the model segments each and diffs them into a confidence-scored change layer — new construction, removals, modifications. Then drag the before/after swipe to inspect it. The output is a first-class, lineage-tracked dataset, not a throwaway render.

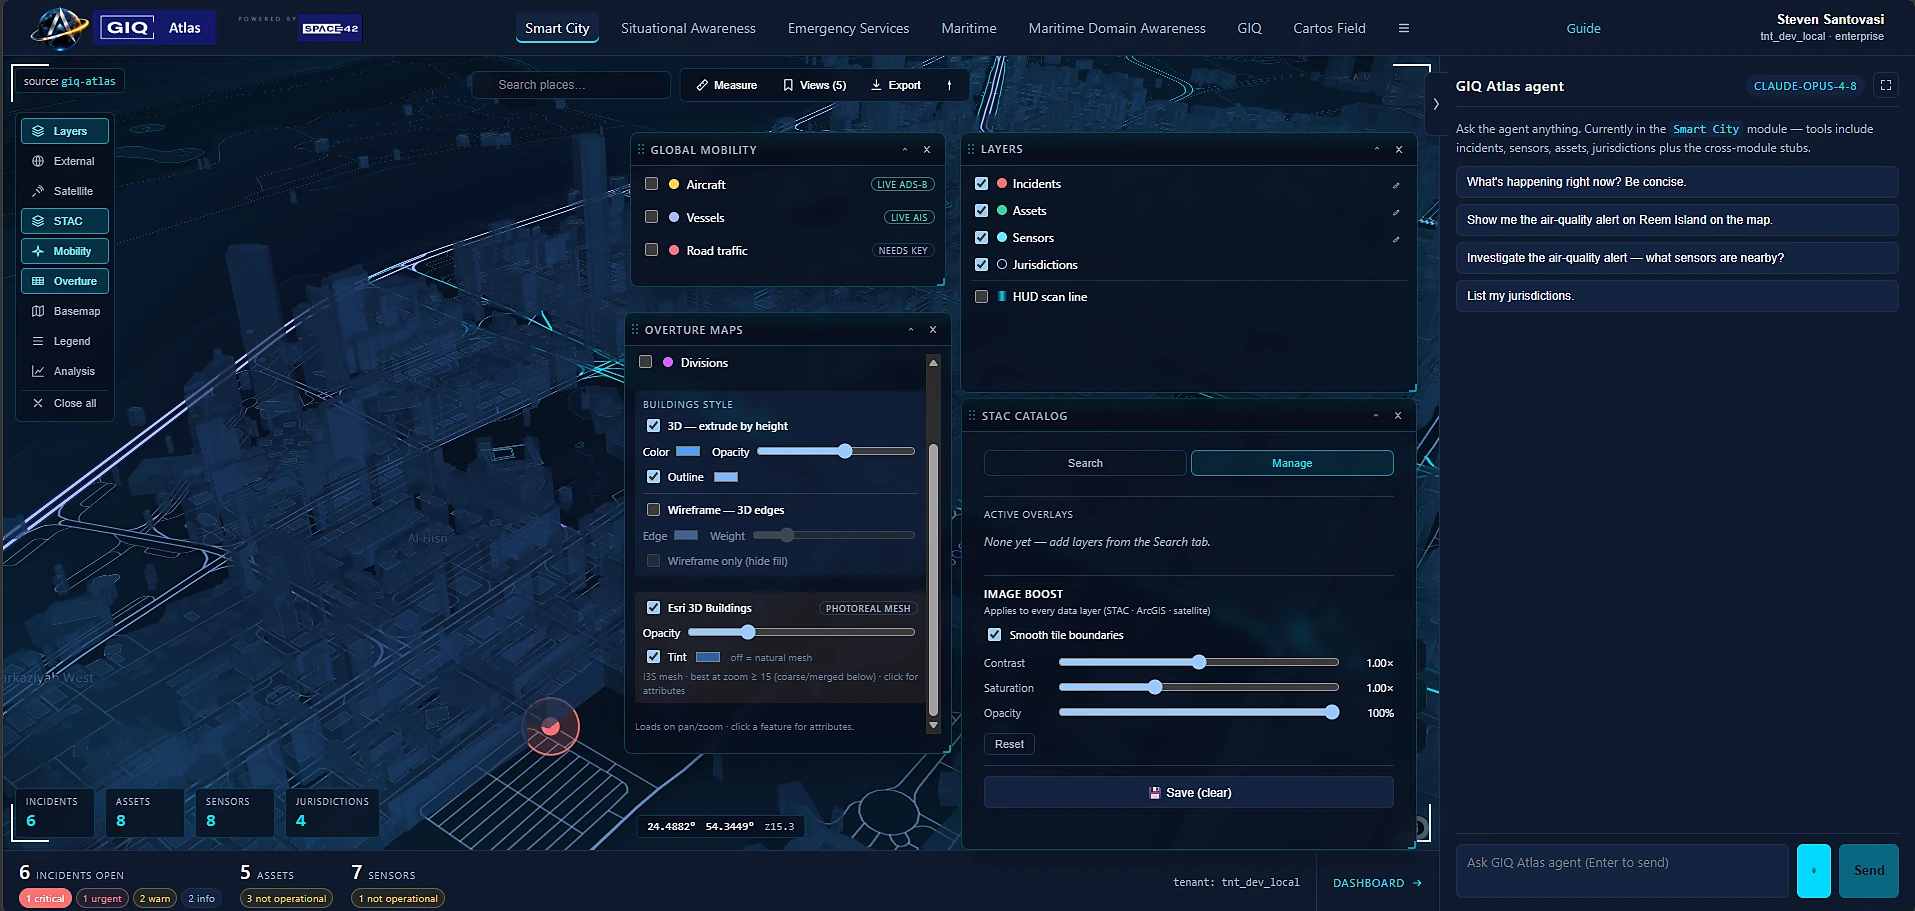
STAC · Manage & Image Boost The STAC catalog Manage tab: active overlays with on/off and opacity, plus a global Image Boost control for contrast, saturation, opacity, and smooth tile boundaries across every data layer.

Tune every layer like a darkroom

Manage active imagery overlays — toggle, set opacity, save — and dial a global Image Boost: contrast, saturation, opacity, and smooth tile boundaries applied across every raster layer at once, so the whole picture reads exactly how you need it.

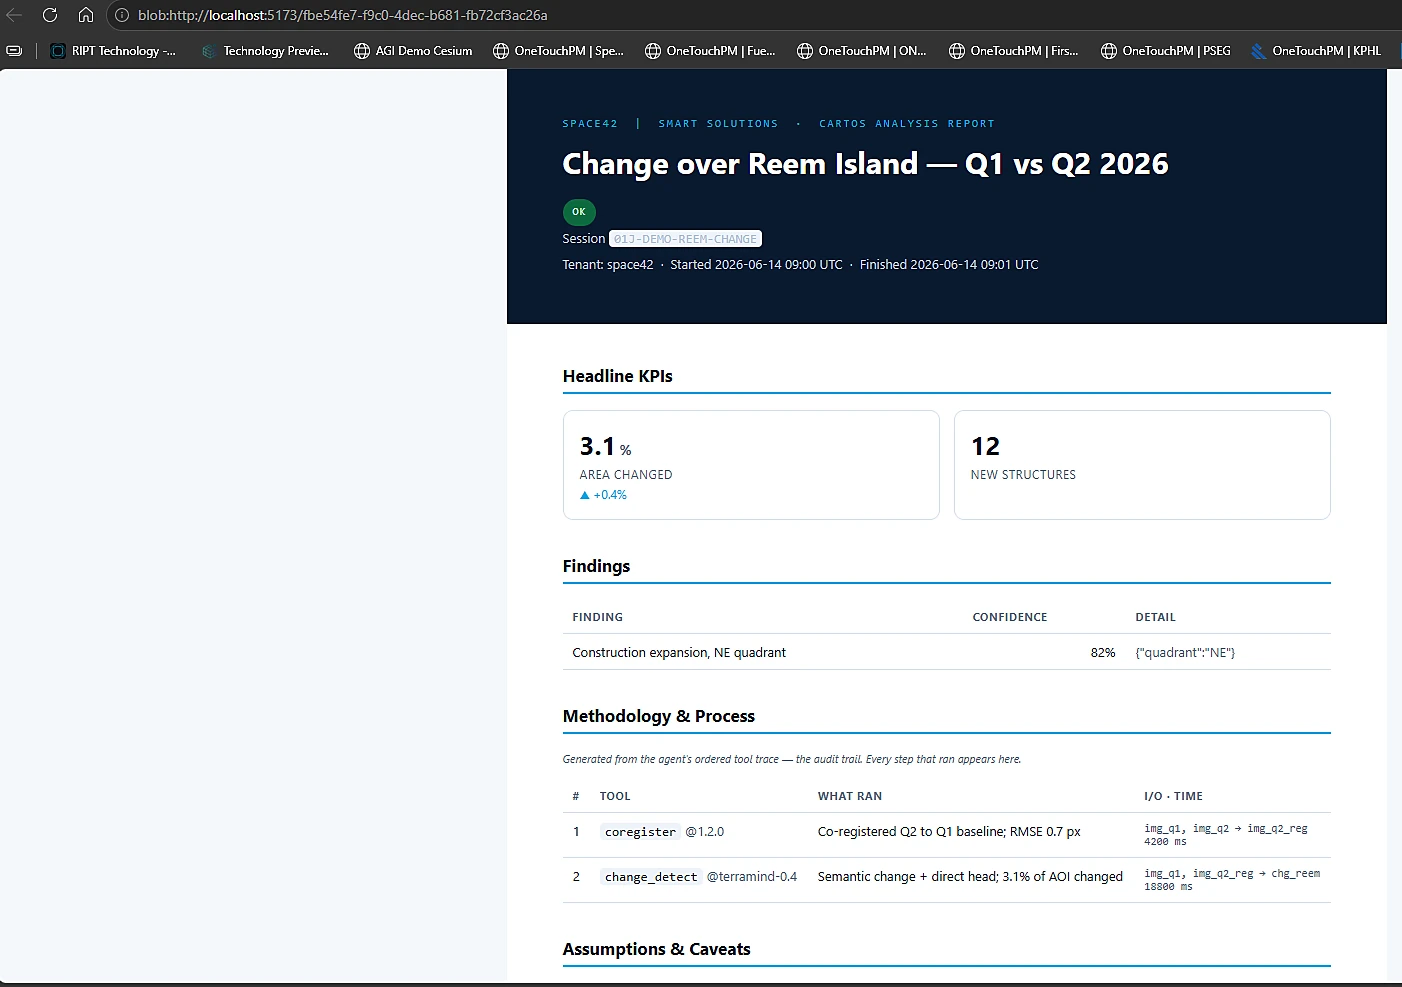
Reporting · Auditable export A generated Cartos analysis report with a methodology section built from the agent's tool trace, KPIs, findings, and assumptions.

A finished report, not just a result

Any analysis session renders to an auditable HTML/DOCX/PDF report — KPIs, findings, assumptions, and a methodology built automatically from the steps that ran. The work explains itself.

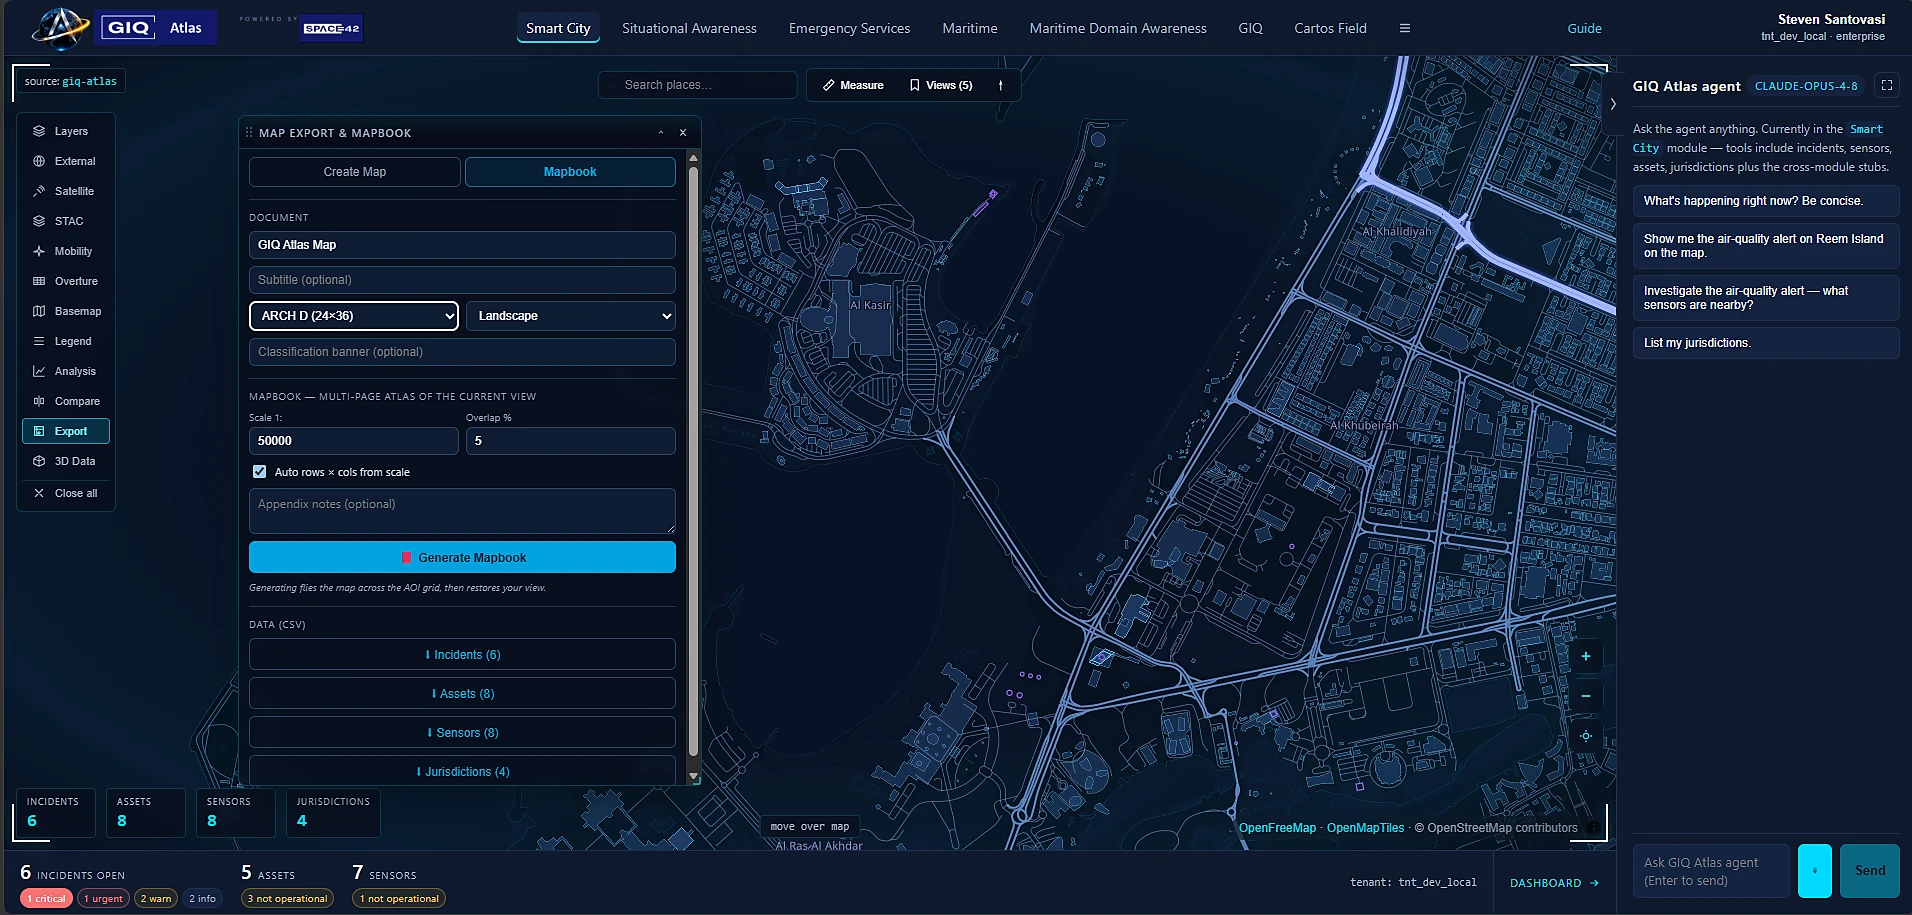
And the map itself exports as a cartographic PDF — scale bar, north arrow, neatline — or a multi-page mapbook that tiles an area into print-ready sheets. A one-click screen capture, too.

06 · Compare, build in 3D, take it to print

Compare any two layers, stand inside the data in 3D, and export it print-ready.

The same workspace lets you put two layers head-to-head, drop a real point cloud at its true coordinates and walk the ground, and turn the view into a cartographic deliverable — without leaving the map.

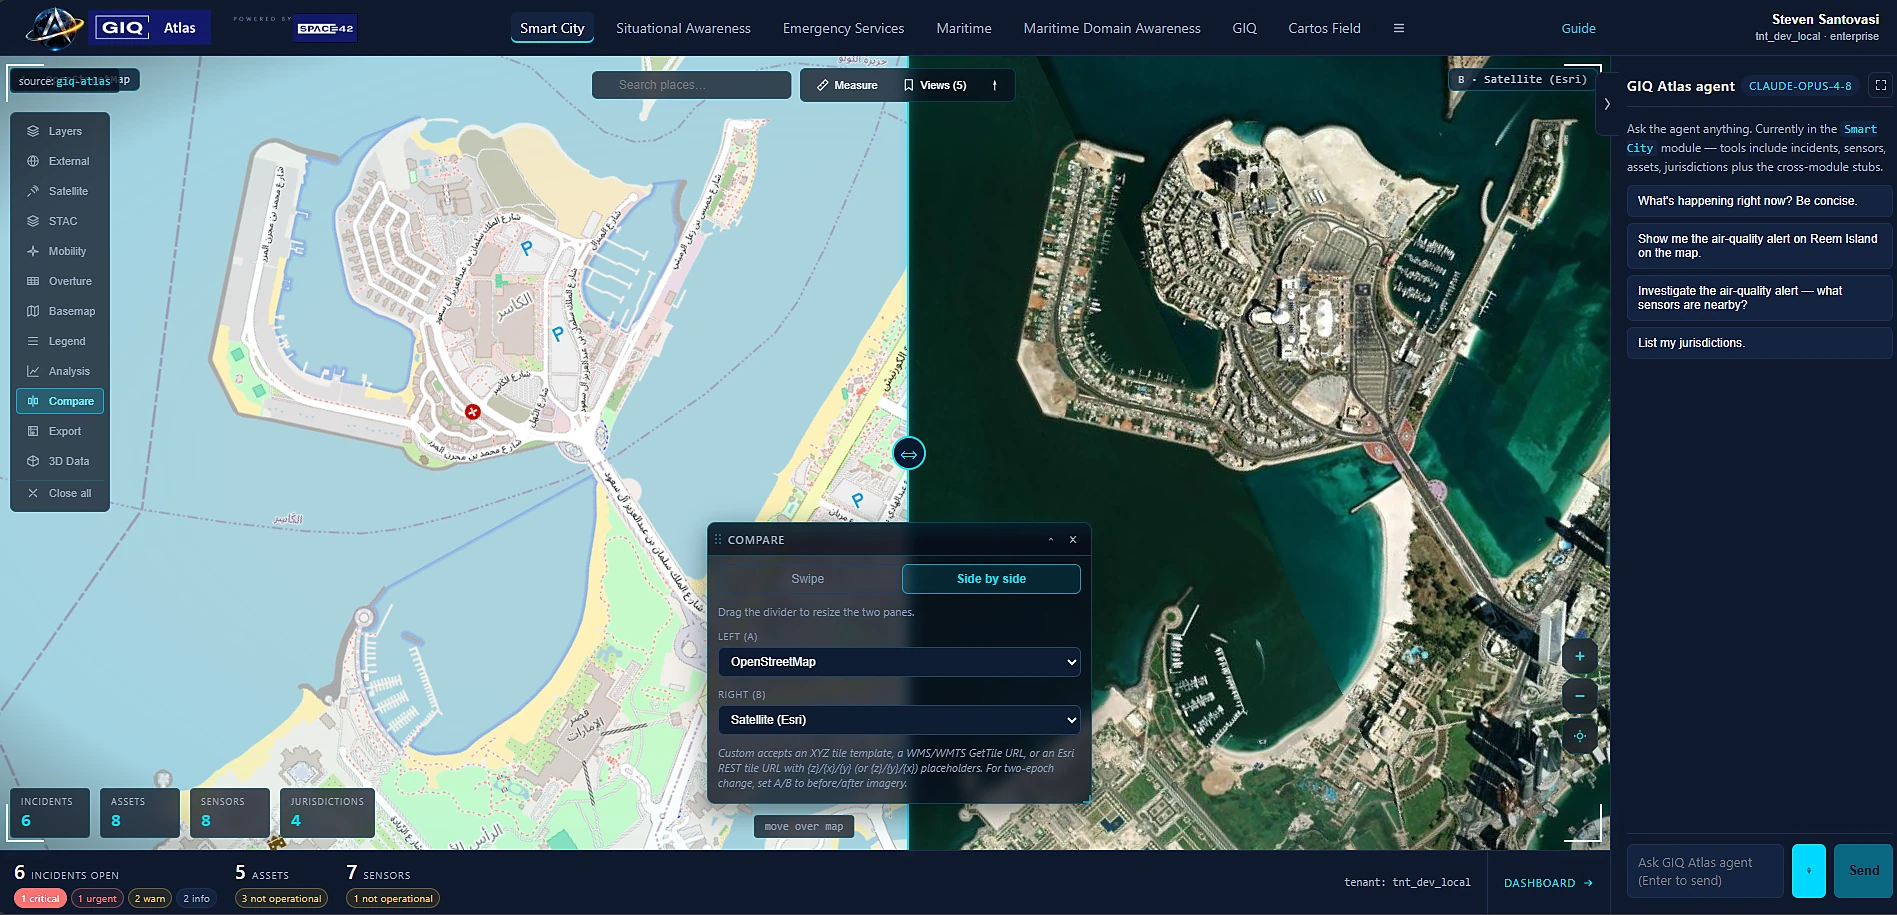
Compare · Swipe & side-by-side The Compare tool in side-by-side mode: two camera-synced map panes, each showing a different layer, split by a draggable divider.

Two layers, head-to-head

Wipe one layer over another with a swipe divider, or split the screen into two side-by-side panes — both camera-synced, so panning or zooming either side moves both. Each side picks from the full catalog: basemaps, Esri services, NASA GIBS satellite, any WMS/WMTS/Esri-REST URL, or the current map with its live data layers. Perfect for before/after change.

Map Export · Cartographic PDF & mapbook The Map Export panel generating a multi-page mapbook PDF that tiles an area of interest into print-ready cartographic sheets.

A deliverable, not a screenshot

Export the view as a cartographic PDF — title block, scale bar, north arrow, neatline — in templates from operational briefing to field map, at paper sizes up to 42×60 and custom. Or generate a multi-page mapbook that tiles an AOI into sheets, plus a georeferenced GeoPDF that opens in QGIS/ArcGIS.

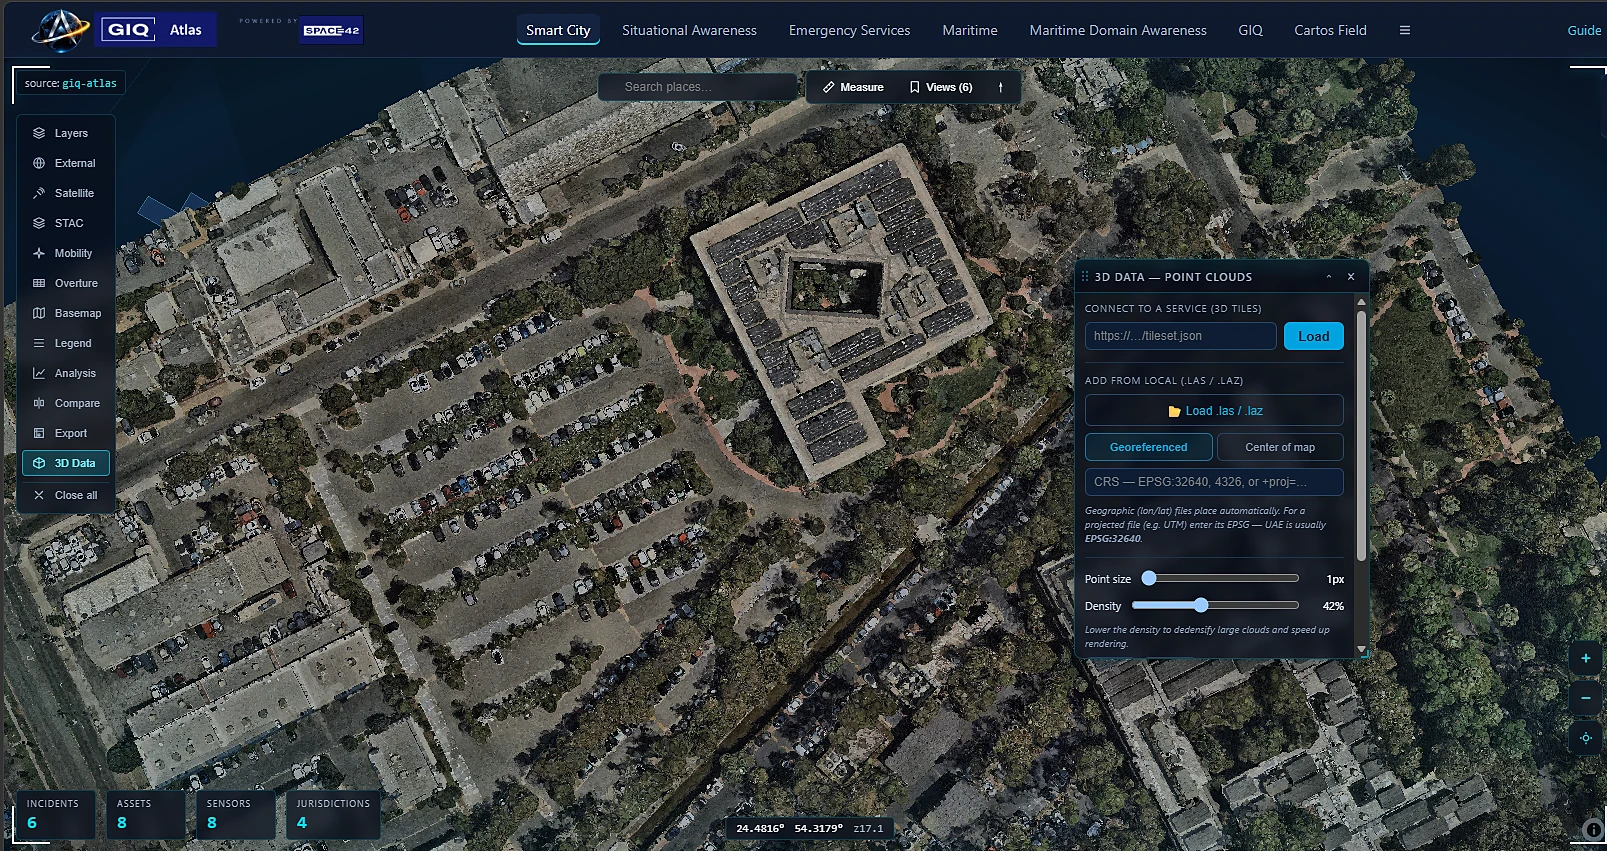
3D Data · Point clouds A LAS point cloud rendered in 3D over the Cartos map at a near-ground viewing angle, placed at its true geospatial coordinates.

Stand inside the data

Serve 3D Tiles from a service, or drop a local LAS/LAZ point cloud that lands at its true geospatial x,y,z (reprojected from its CRS). A density slider keeps multi-million-point clouds smooth, and you can pitch all the way to a 90° ground-level view — GPU-free, in the browser.

07 · Configure & reach the field

Turn capabilities on — and reach the ground.

The same workspace is configured per client, in-app, across three admin tiers — and now extends to a mobile field app whose captures flow back into the modules above. No vendor ticket to add a module, build a feature, onboard a user, or stand up a field app.

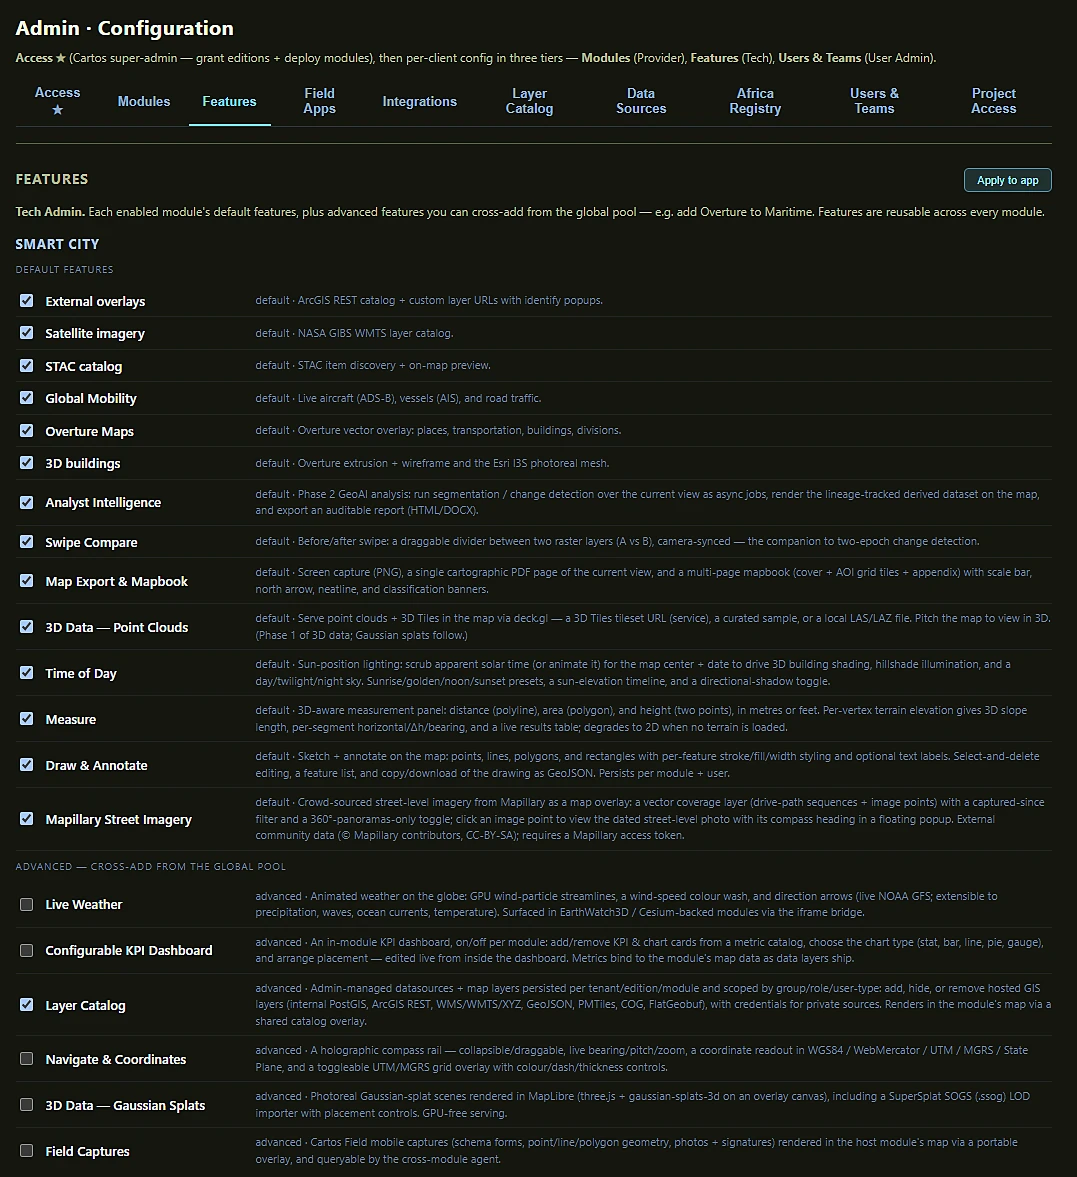
Admin · Modules & Features The admin Configuration screen: per-module default features plus advanced features cross-added from a global pool.

Configure the deployment, in-app

Provider Admins choose modules; Tech Admins turn features on and cross-add advanced ones across modules; User Admins run their own users and per-user access. Keycloak-backed, sovereign, self-service.

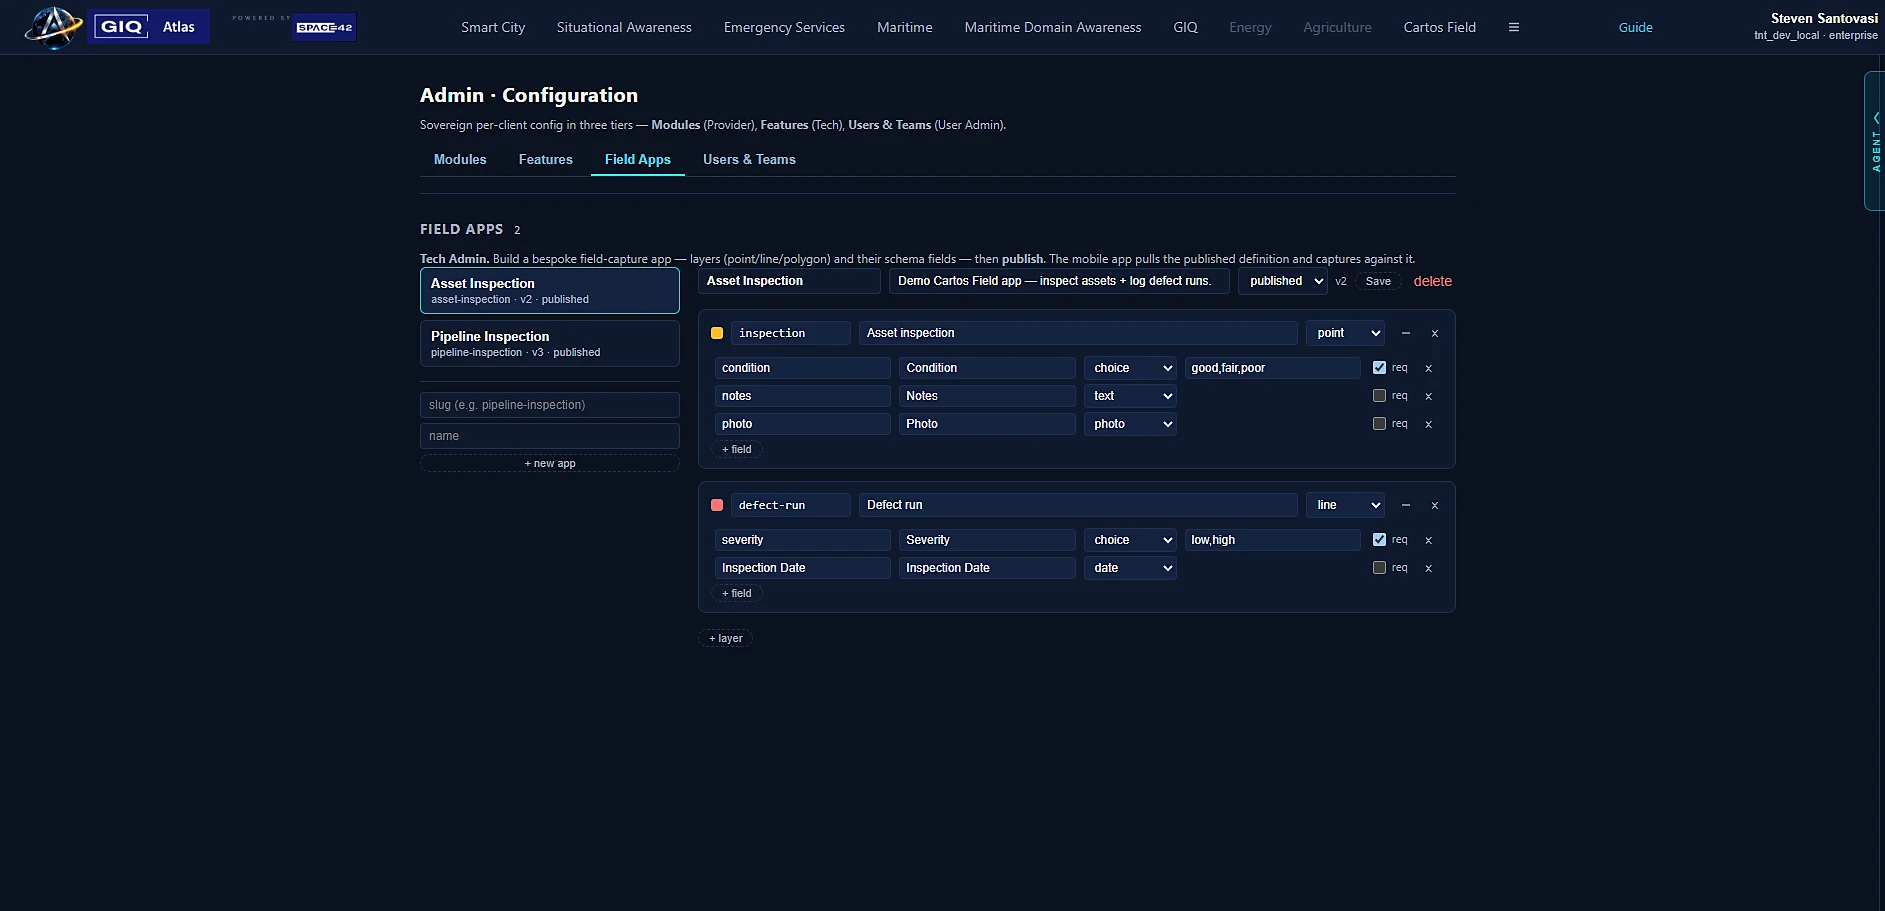
Admin · Field Apps builder The no-code Field Apps builder: define a mobile field app's layers and schema fields, then assign which modules its captures surface in.

Build a field app — no code, no app cycle

Define layers and schema fields in the console; field workers capture offline on a native app; the data syncs back and surfaces inside the assigned module's map, queryable by the agent. Explore Cartos Field

The contrast

Why this is a different category — not a nicer GIS.

The legacy desktop GIS model was built for a cartographer at a workstation. Cartos is built for an operator, an analyst, and an agent working the same picture together.

 Aging desktop GISCartos
Getting startedInstall, license, train for weeksOpen a URL — no experience required
Doing the analysisHunt through a toolbox of hundreds of toolsAsk the agent in plain language
Adding dataWrangle formats, projections, connectionsBrowse or search a marketplace, click add
New use caseA new project, server, and integratorSwitch on a module on the same fabric
2D, 3D & dashboardsSeparate apps and add-on licensesOne workspace, all included
Where it runsVendor cloud or aging on-premSovereign, in-territory, on infra you control
Where it's goingUpgrade treadmill, data lock-inCompounds into change detection, 3D & auto-reporting

If a new analyst can be useful on day one without a course, the tool finally fits the mission — not the other way around.

One interface, every industry

The same workspace, purpose-built eight ways.

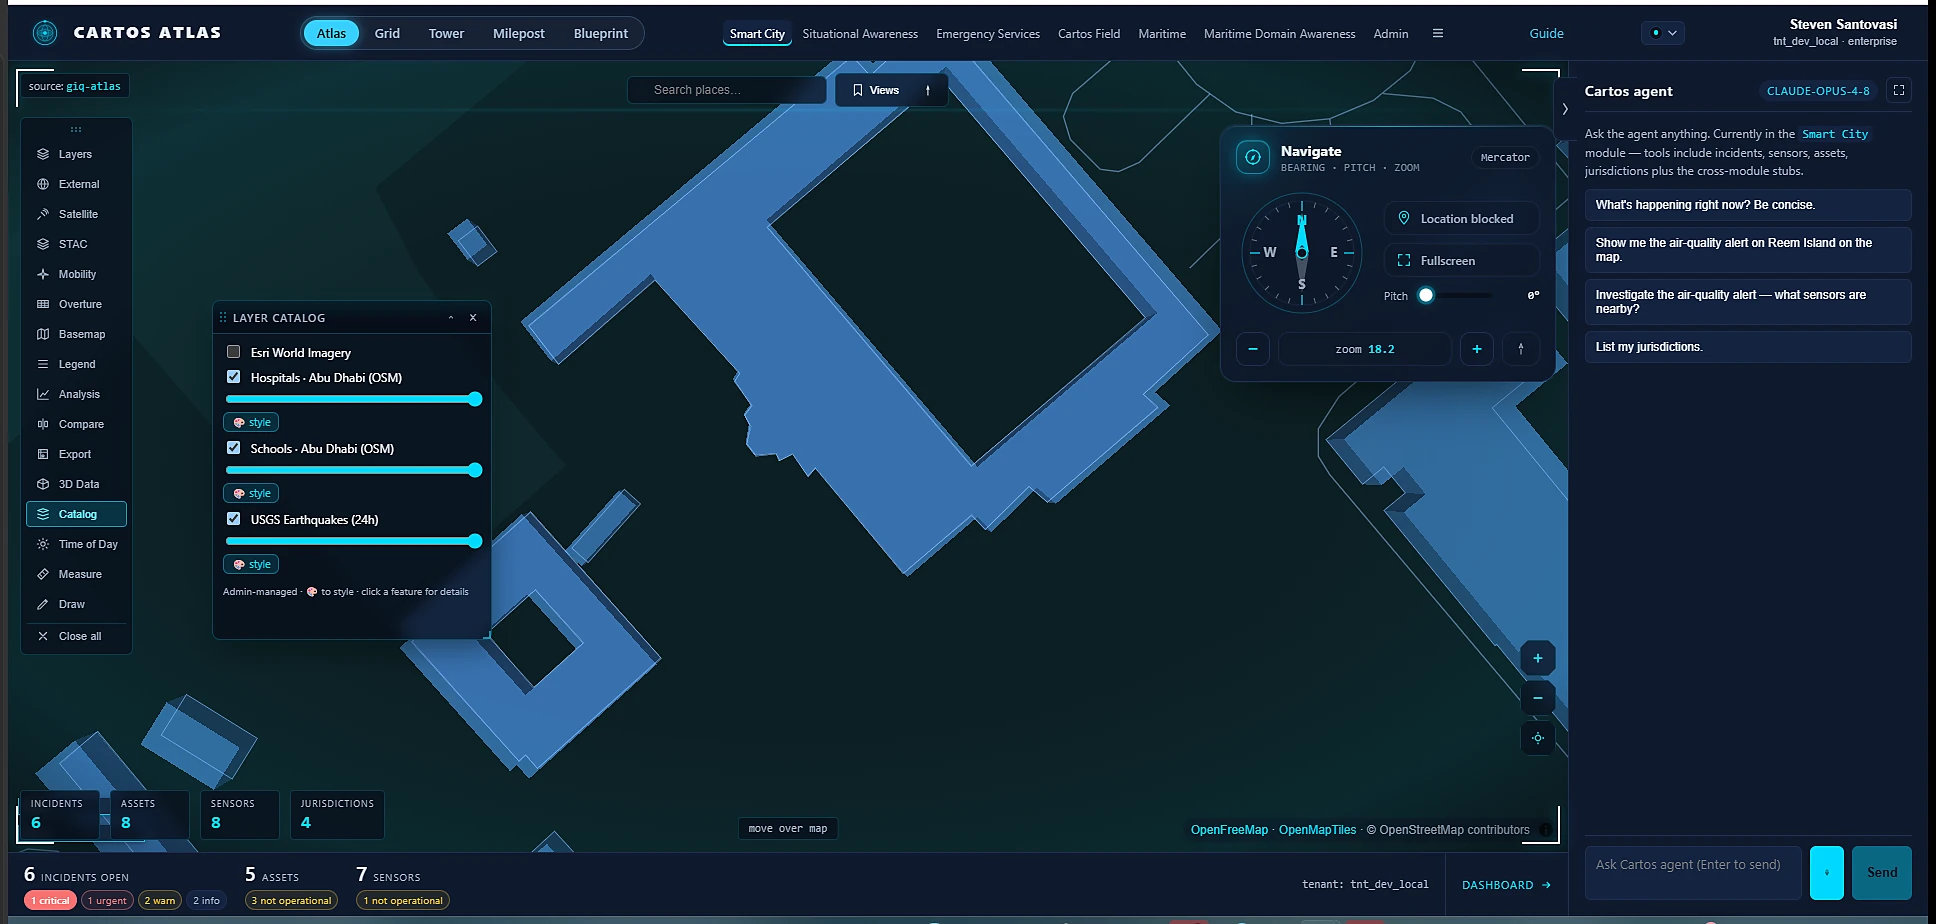
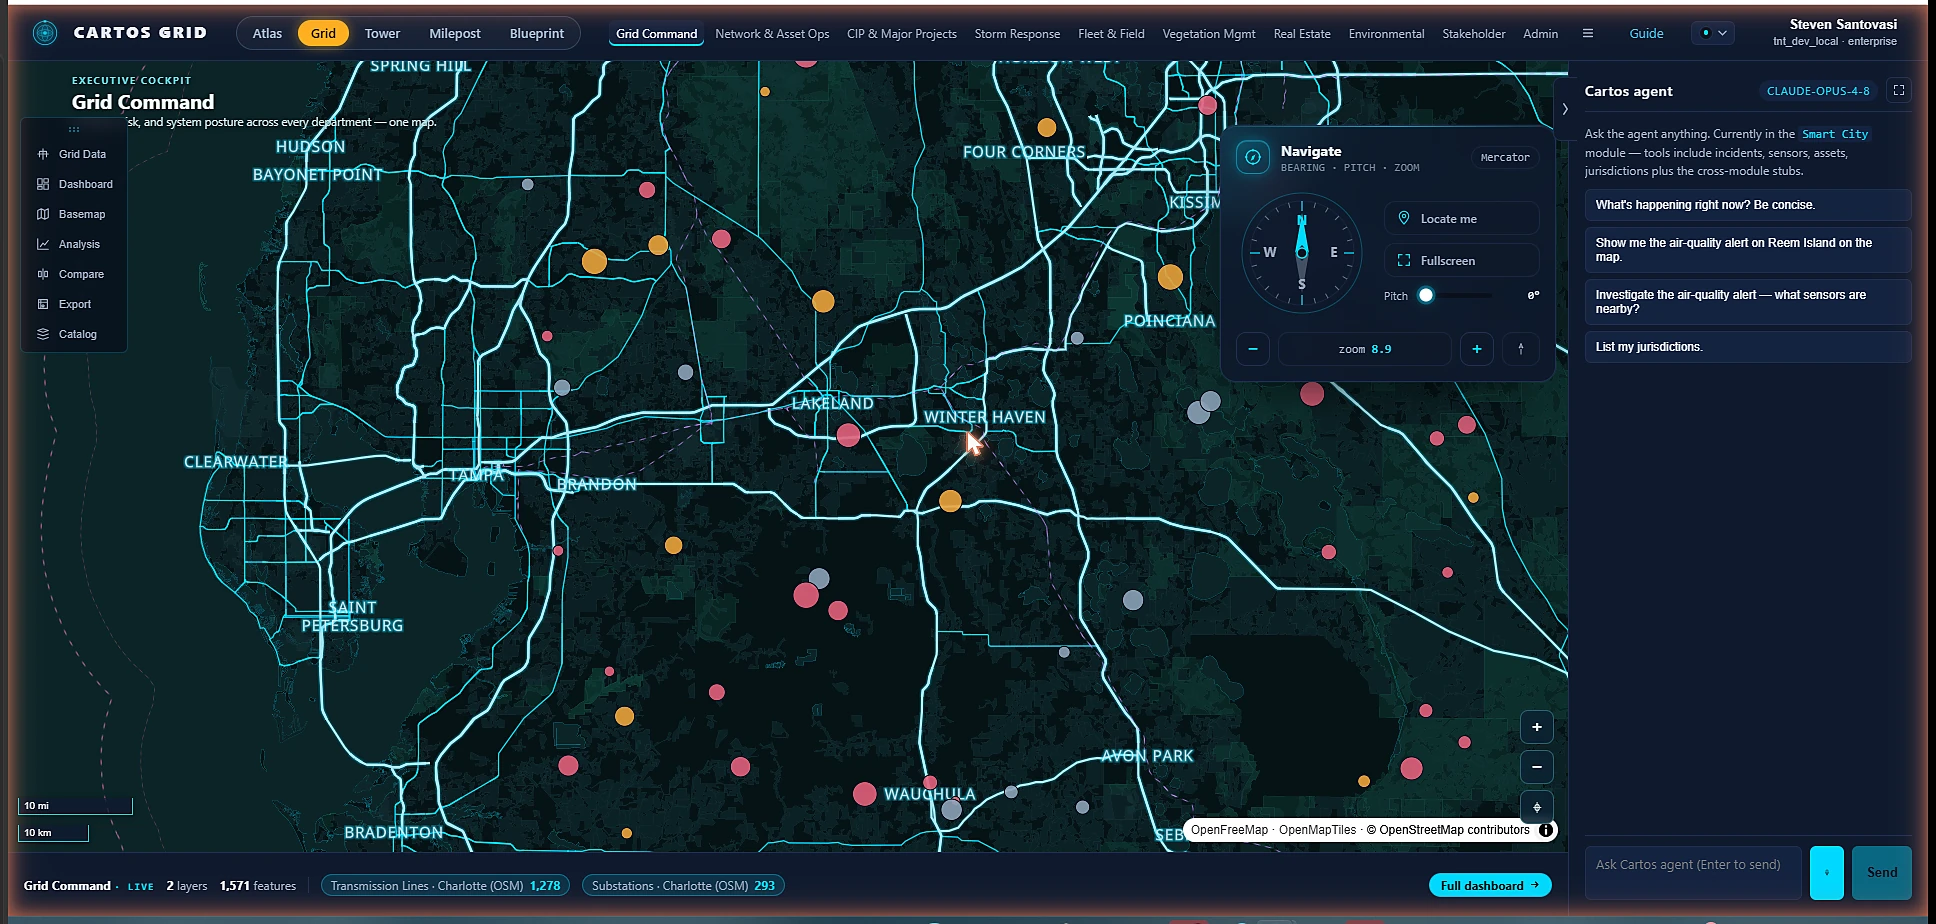
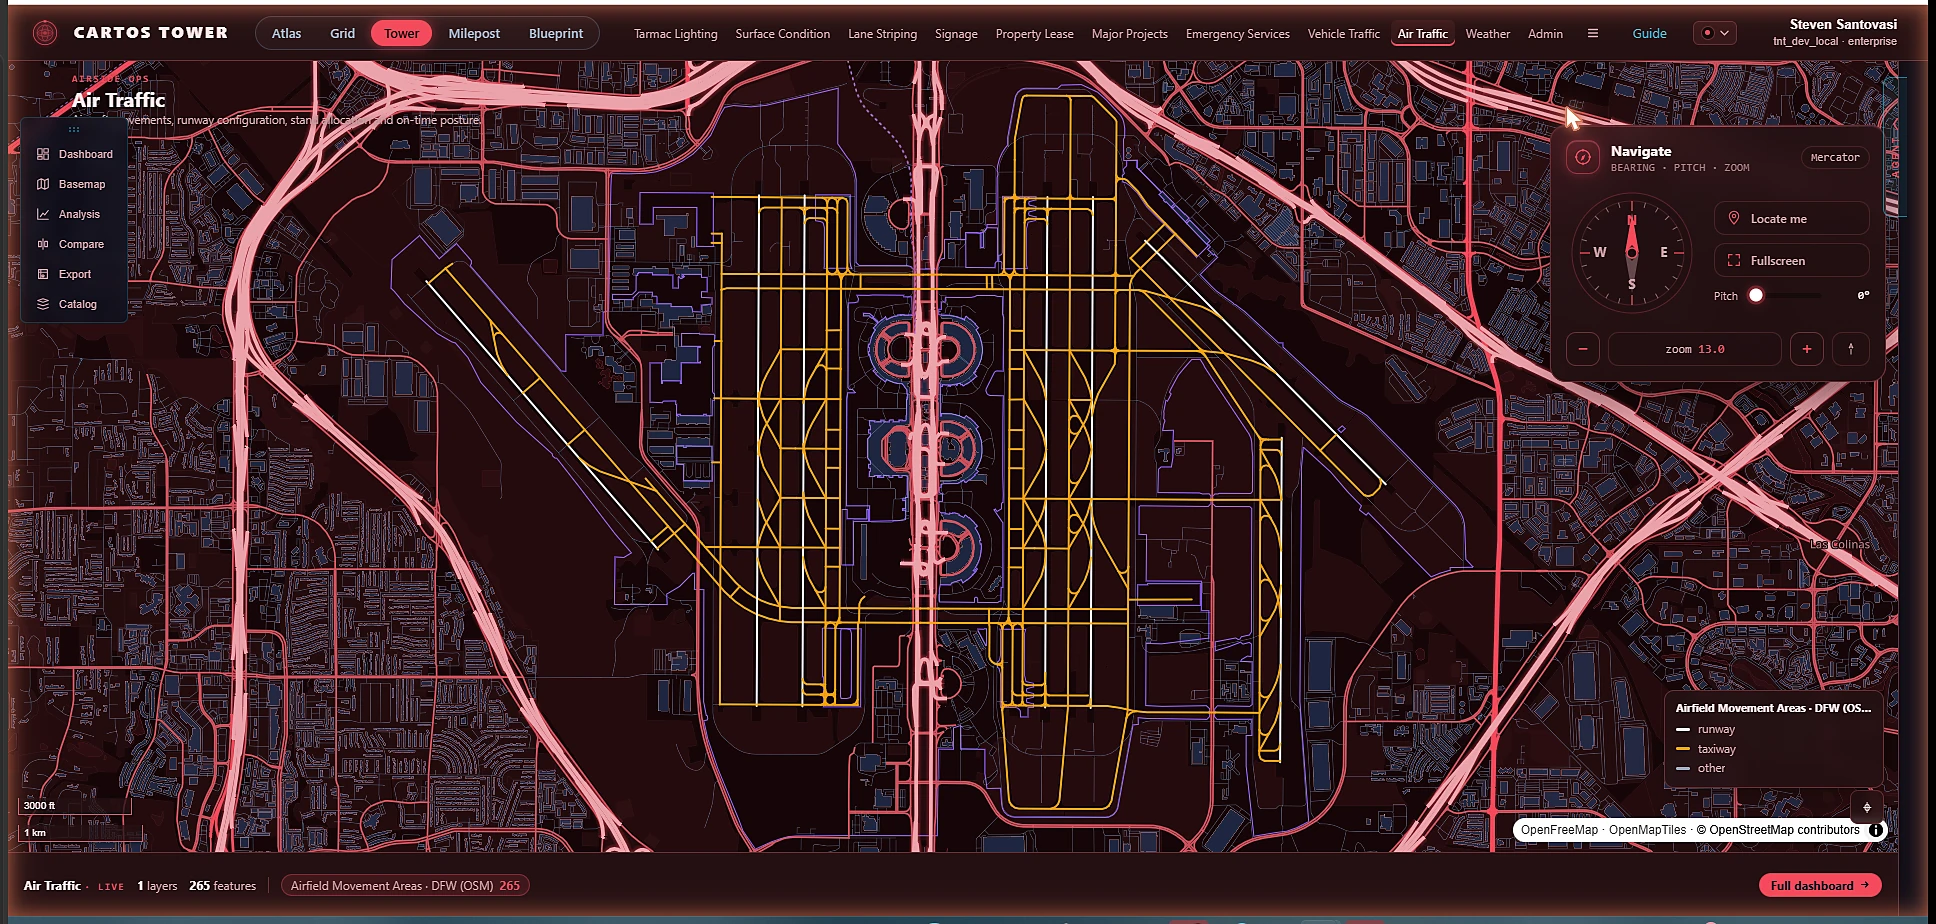
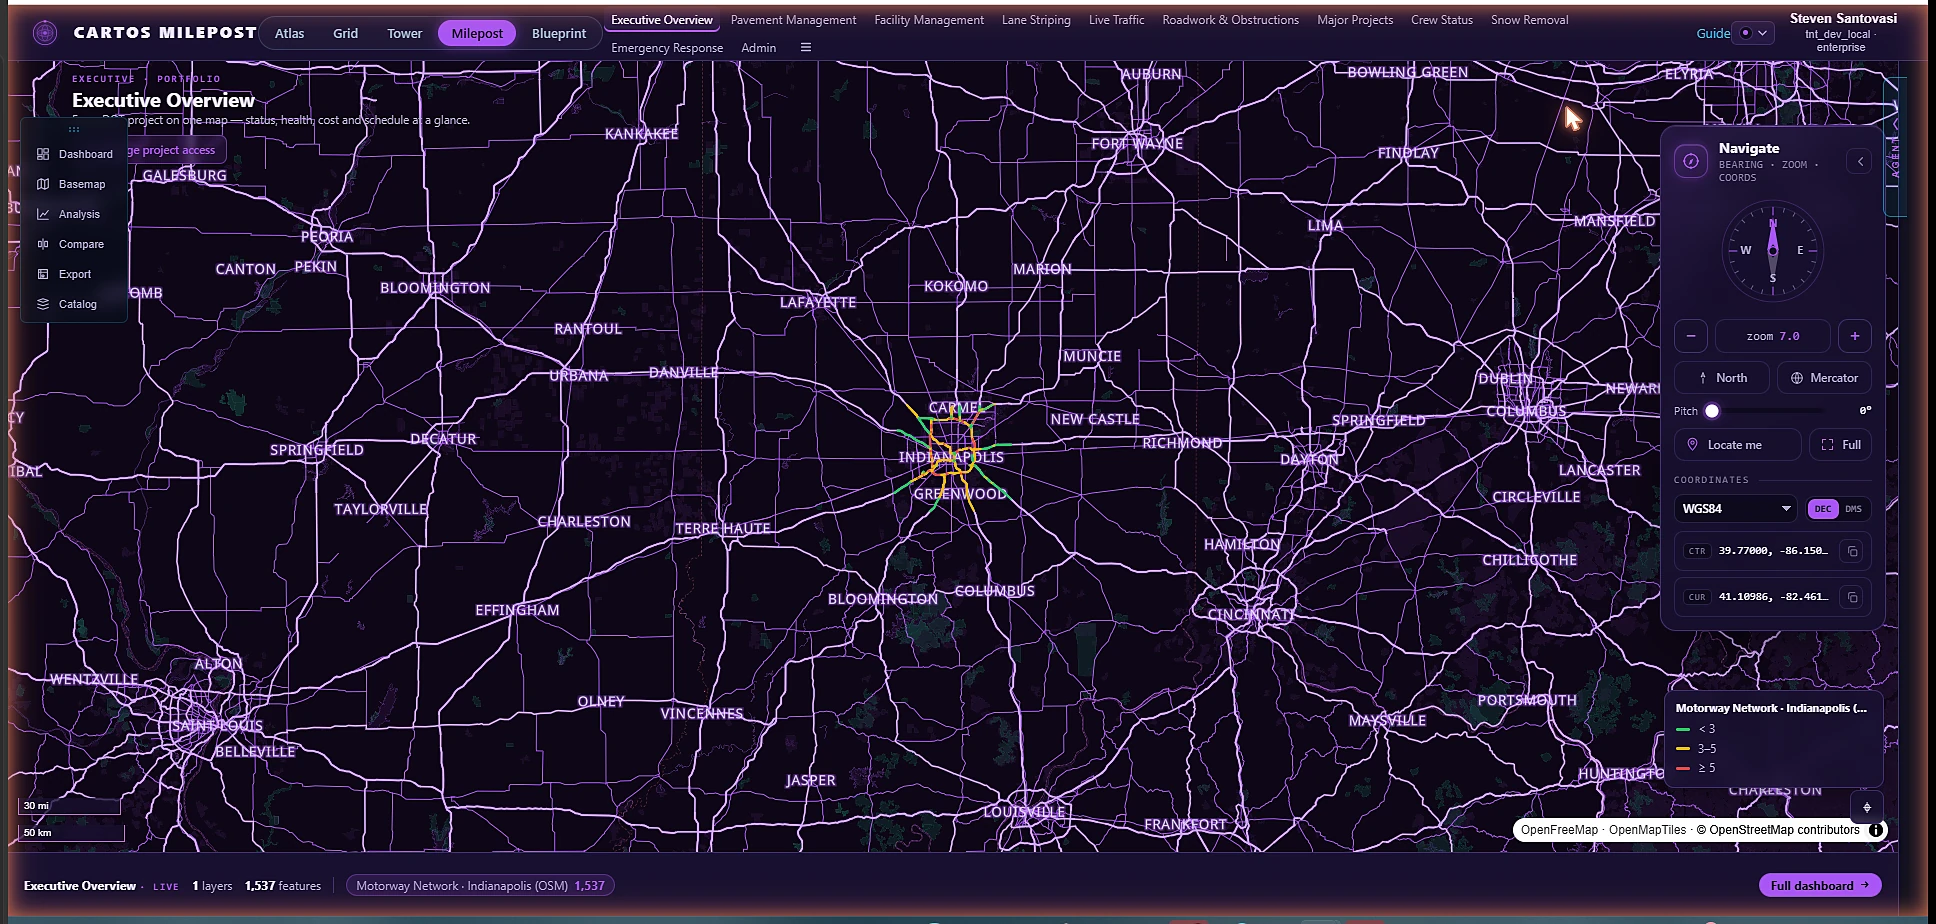
Everything above is the engine. Industries run over it as licensed editions — the same map, agent, catalogue and dashboards, re-skinned and re-catalogued per vertical. Nine editions are live today; five are pictured below — Cartos Africa, Guardian, Sentry and Harvest (the newest four) are covered in full on the editions page.

Atlas · Government Cartos Atlas — Smart City with 3D extruded buildings, the live layer catalogue (hospitals, schools, earthquakes), the 3D navigate widget and the AI agent.

Cartos Atlas — Government

Cities, coasts and crisis on one screen: 3D buildings, a live catalogue of real data, and the AI analyst wired in from the first click.

Grid · Electric utility Cartos Grid — Grid Command over the Charlotte network: 1,278 transmission lines and 293 substations, live.

Cartos Grid — Electric utility

Grid Command over a live network — 1,571 features, nine departments, and a KPI dashboard wired to the utility's systems of record.

Tower · Airport Cartos Tower — the DFW airfield rendered from OSM (runways, taxiways, movement areas) in the crimson theme.

Cartos Tower — Airport

Airside to landside: the DFW airfield, ten operational departments, one operating picture.

Milepost · Transportation Cartos Milepost — Executive Overview: the statewide Indianapolis motorway network (1,537 features) with graduated symbology.

Cartos Milepost — DOT

An executive portfolio of every project over a statewide network, then drill to pavement, traffic and winter ops.

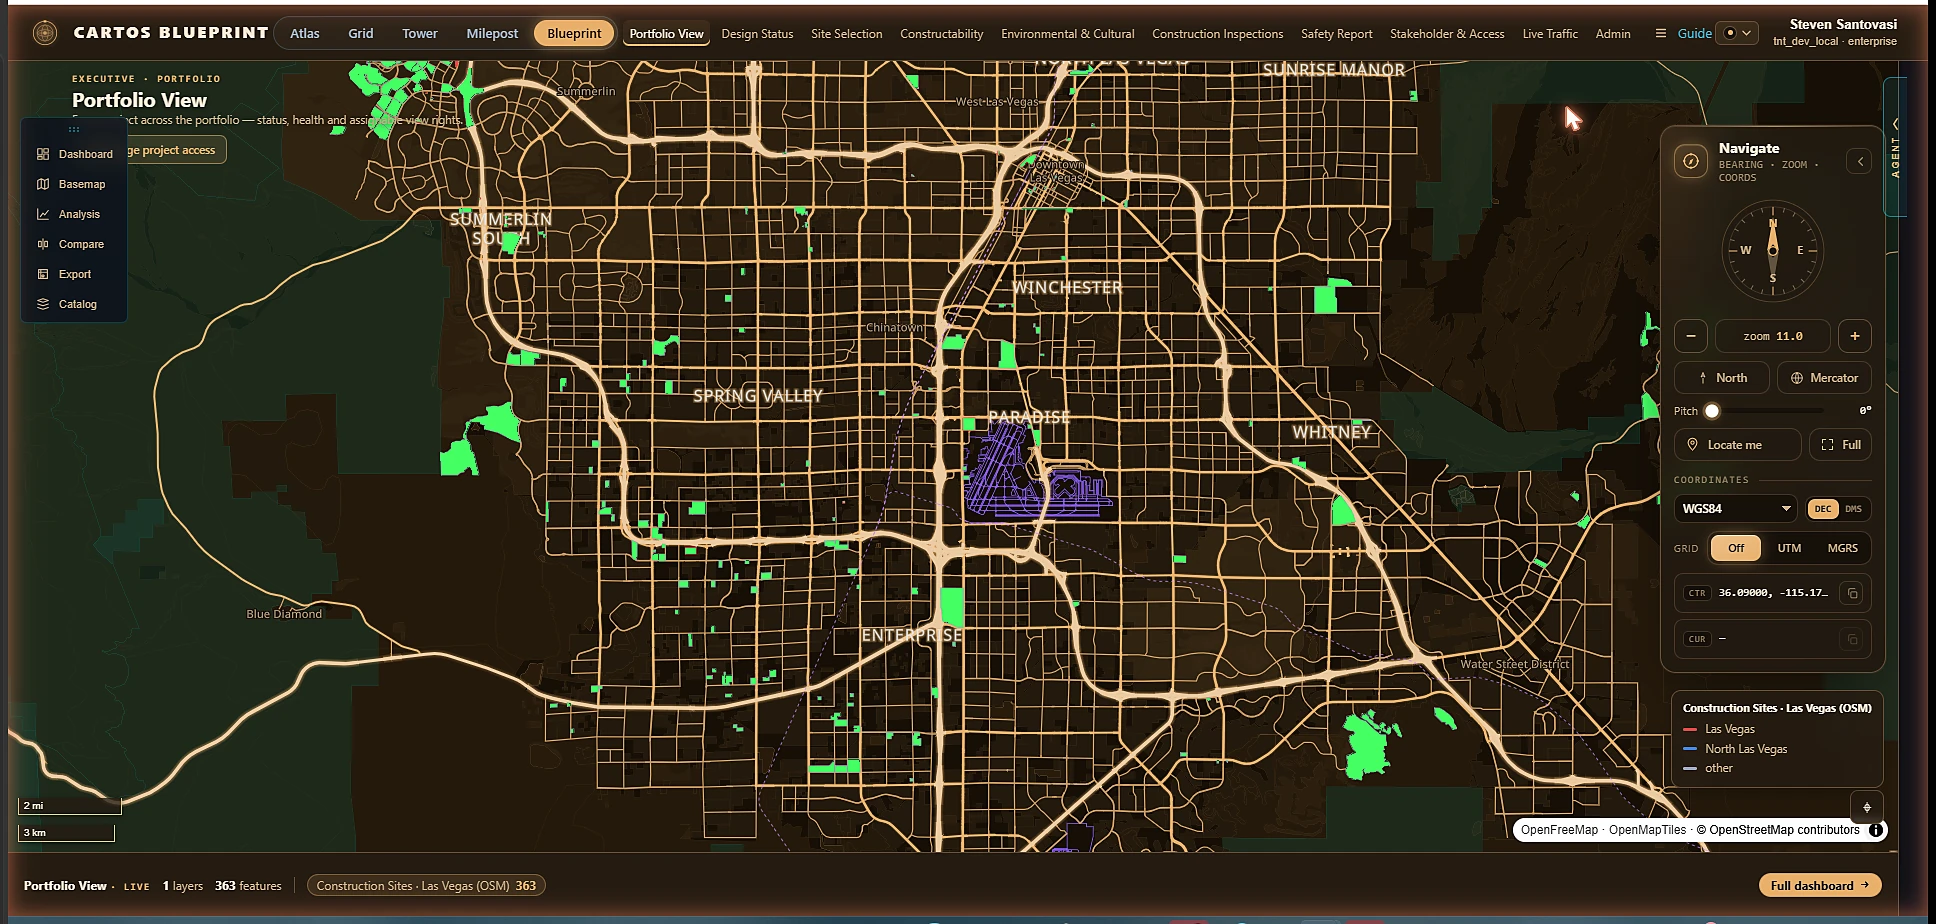
Blueprint · Infrastructure Cartos Blueprint — Portfolio View across Las Vegas construction sites in the desert-gold theme.

Cartos Blueprint — AEC

A capital-project portfolio across a whole metro, with portfolio and per-project view rights assignable to a team or user.

See all nine live editions

See it on your geography

Put your own area on this screen.

Bring a real operational workflow and a sovereignty constraint; we'll stand it up on the platform — your data, your territory, your imagery — under NDA.